Coming to Terms with Reality. Evaluation of the Belgian Debt Relief ...
Coming to Terms with Reality. Evaluation of the Belgian Debt Relief ...
Coming to Terms with Reality. Evaluation of the Belgian Debt Relief ...
You also want an ePaper? Increase the reach of your titles
YUMPU automatically turns print PDFs into web optimized ePapers that Google loves.
| 160 |<br />
Annexes<br />
7. Challenges and Risks<br />
7.1 The <strong>Debt</strong> S<strong>to</strong>ck<br />
7.2 The <strong>Debt</strong> Flow<br />
7.3 Major Risks<br />
7.4 Main Challenges<br />
8. Conclusion<br />
Persons contacted<br />
References<br />
<strong>Coming</strong> <strong>to</strong> <strong>Terms</strong> <strong>with</strong> <strong>Reality</strong><br />
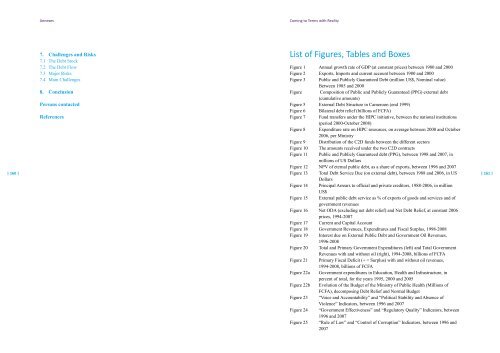
List <strong>of</strong> Figures, Tables and Boxes<br />
Figure 1 Annual growth rate <strong>of</strong> GDP (at constant prices) between 1980 and 2000<br />
Figure 2 Exports, Imports and current account between 1980 and 2000<br />
Figure 3 Public and Publicly Guaranteed <strong>Debt</strong> (million US$, Nominal value)<br />
Between 1985 and 2000<br />
Figure Composition <strong>of</strong> Public and Publicly Guaranteed (PPG) external debt<br />
(cumulative amounts)<br />
Figure 5 External <strong>Debt</strong> Structure in Cameroon (end 1999)<br />
Figure 6 Bilateral debt relief (billions <strong>of</strong> FCFA)<br />
Figure 7 Fund transfers under <strong>the</strong> HIPC initiative, between <strong>the</strong> national institutions<br />
(period 2000-Oc<strong>to</strong>ber 2008)<br />
Figure 8 Expenditure rate on HIPC resources, on average between 2000 and Oc<strong>to</strong>ber<br />
2006, per Ministry<br />
Figure 9 Distribution <strong>of</strong> <strong>the</strong> C2D funds between <strong>the</strong> different sec<strong>to</strong>rs<br />
Figure 10 The amounts received under <strong>the</strong> two C2D contracts<br />
Figure 11 Public and Publicly Guaranteed debt (PPG), between 1998 and 2007, in<br />
millions <strong>of</strong> US Dollars<br />
Figure 12 NPV <strong>of</strong> eternal public debt, as a share <strong>of</strong> exports, between 1996 and 2007<br />
Figure 13 Total <strong>Debt</strong> Service Due (on external debt), between 1988 and 2006, in US<br />
Dollars<br />
Figure 14 Principal Arrears <strong>to</strong> <strong>of</strong>ficial and private credi<strong>to</strong>rs, 1988-2006, in million<br />
US$<br />
Figure 15 External public debt service as % <strong>of</strong> exports <strong>of</strong> goods and services and <strong>of</strong><br />
government revenues<br />
Figure 16 Net ODA (excluding net debt relief) and Net <strong>Debt</strong> <strong>Relief</strong>, at constant 2006<br />
prices, 1994-2007<br />
Figure 17 Current and Capital Account<br />
Figure 18 Government Revenues, Expenditures and Fiscal Surplus, 1998-2008<br />
Figure 19 Interest due on External Public <strong>Debt</strong> and Government Oil Revenues,<br />
1996-2008<br />
Figure 20 Total and Primary Government Expenditures (left) and Total Government<br />
Revenues <strong>with</strong> and <strong>with</strong>out oil (right), 1994-2008, billions <strong>of</strong> FCFA<br />
Figure 21 Primary Fiscal Deficit (+ = Surplus) <strong>with</strong> and <strong>with</strong>out oil revenues,<br />
1994-2008, billions <strong>of</strong> FCFA<br />
Figure 22a Government expenditures in Education, Health and Infrastructure, in<br />
percent <strong>of</strong> <strong>to</strong>tal, for <strong>the</strong> years 1995, 2000 and 2005<br />
Figure 22b Evolution <strong>of</strong> <strong>the</strong> Budget <strong>of</strong> <strong>the</strong> Ministry <strong>of</strong> Public Health (Millions <strong>of</strong><br />
FCFA), decomposing <strong>Debt</strong> <strong>Relief</strong> and Normal Budget<br />
Figure 23 “Voice and Accountability” and “Political Stability and Absence <strong>of</strong><br />
Violence” Indica<strong>to</strong>rs, between 1996 and 2007<br />
Figure 24 “Government Effectiveness” and “Regula<strong>to</strong>ry Quality” Indica<strong>to</strong>rs, between<br />
1996 and 2007<br />
Figure 25 “Rule <strong>of</strong> Law” and “Control <strong>of</strong> Corruption” Indica<strong>to</strong>rs, between 1996 and<br />
2007<br />
| 161 |


