Coming to Terms with Reality. Evaluation of the Belgian Debt Relief ...
Coming to Terms with Reality. Evaluation of the Belgian Debt Relief ...
Coming to Terms with Reality. Evaluation of the Belgian Debt Relief ...

You also want an ePaper? Increase the reach of your titles
YUMPU automatically turns print PDFs into web optimized ePapers that Google loves.
| 192 |<br />
Annexes<br />
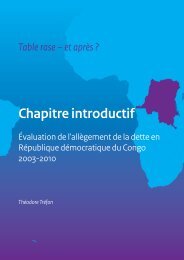
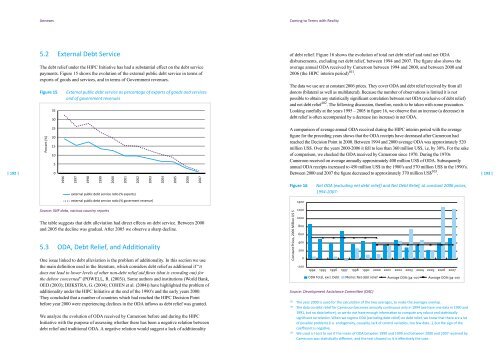
5.2 External <strong>Debt</strong> Service<br />
The debt relief under <strong>the</strong> HIPC Initiative has had a substantial effect on <strong>the</strong> debt service<br />
payments. Figure 15 shows <strong>the</strong> evolution <strong>of</strong> <strong>the</strong> external public debt service in terms <strong>of</strong><br />
exports <strong>of</strong> goods and services, and in terms <strong>of</strong> Government revenues.<br />
Figure 15 External public debt service as percentage <strong>of</strong> exports <strong>of</strong> goods and services<br />
and <strong>of</strong> government revenues<br />
Percent (%)<br />
35<br />
30<br />
25<br />
20<br />
15<br />
10<br />
5<br />
0<br />
1996<br />
1997<br />
1998<br />
1999<br />
external public debt service ratio (% exports)<br />
external public debt service ratio (% goverment revenue)<br />
Source: IMF data, various country reports<br />
The table suggests that debt alleviation had direct effects on debt service. Between 2000<br />
and 2005 <strong>the</strong> decline was gradual. After 2005 we observe a sharp decline.<br />
5.3 ODA, <strong>Debt</strong> <strong>Relief</strong>, and Additionality<br />
2000<br />
2001<br />
One issue linked <strong>to</strong> debt alleviation is <strong>the</strong> problem <strong>of</strong> additionality. In this section we use<br />
<strong>the</strong> main definition used in <strong>the</strong> literature, which considers debt relief as additional if “it<br />
does not lead <strong>to</strong> lower levels <strong>of</strong> o<strong>the</strong>r non-debt relief aid flows (that is crowding out) for<br />
<strong>the</strong> deb<strong>to</strong>r concerned” (POWELL, R. (2003)). Some authors and institutions (World Bank,<br />
OED (2003); DIJKSTRA, G. (2004); COHEN et al. (2004)) have highlighted <strong>the</strong> problem <strong>of</strong><br />
additionality under <strong>the</strong> HIPC Initiative at <strong>the</strong> end <strong>of</strong> <strong>the</strong> 1990’s and <strong>the</strong> early years 2000.<br />
They concluded that a number <strong>of</strong> countries which had reached <strong>the</strong> HIPC Decision Point<br />
before year 2000 were experiencing declines in <strong>the</strong> ODA inflows as debt relief was granted.<br />
We analyze <strong>the</strong> evolution <strong>of</strong> ODA received by Cameroon before and during <strong>the</strong> HIPC<br />
Initiative <strong>with</strong> <strong>the</strong> purpose <strong>of</strong> assessing whe<strong>the</strong>r <strong>the</strong>re has been a negative relation between<br />
debt relief and traditional ODA. A negative relation would suggest a lack <strong>of</strong> additionality<br />
2002<br />
2003<br />
2004<br />
2005<br />
2006<br />
2007<br />
<strong>Coming</strong> <strong>to</strong> <strong>Terms</strong> <strong>with</strong> <strong>Reality</strong><br />
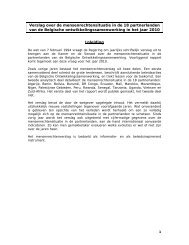
<strong>of</strong> debt relief. Figure 16 shows <strong>the</strong> evolution <strong>of</strong> <strong>to</strong>tal net debt relief and <strong>to</strong>tal net ODA<br />
disbursements, excluding net debt relief, between 1994 and 2007. The figure also shows <strong>the</strong><br />
average annual ODA received by Cameroon between 1994 and 2000, and between 2000 and<br />
2006 (<strong>the</strong> HIPC interim period) 101 .<br />
The data we use are at constant 2006 prices. They cover ODA and debt relief received by from all<br />
donors (bilateral as well as multilateral). Because <strong>the</strong> number <strong>of</strong> observations is limited it is not<br />
possible <strong>to</strong> obtain any statistically significant correlation between net ODA (exclusive <strong>of</strong> debt relief)<br />
and net debt relief 102 . The following discussion, <strong>the</strong>refore, needs <strong>to</strong> be taken <strong>with</strong> some precaution.<br />
Looking carefully at <strong>the</strong> years 1995 – 2005 in figure 16, we observe that an increase (a decrease) in<br />
debt relief is <strong>of</strong>ten accompanied by a decrease (an increase) in net ODA.<br />
A comparison <strong>of</strong> average annual ODA received during <strong>the</strong> HIPC interim period <strong>with</strong> <strong>the</strong> average<br />
figure for <strong>the</strong> preceding years shows that <strong>the</strong> ODA receipts have decreased after Cameroon had<br />
reached <strong>the</strong> Decision Point in 2000. Between 1994 and 2000 average ODA was approximately 520<br />
million US$. Over <strong>the</strong> years 2000-2006 it fell <strong>to</strong> less than 360 million US$, i.e. by 30%. For <strong>the</strong> sake<br />
<strong>of</strong> comparison, we checked <strong>the</strong> ODA received by Cameroon since 1970. During <strong>the</strong> 1970s<br />
Cameroon received on average annually approximately 400 million US$ <strong>of</strong> ODA. Subsequently<br />
annual ODA receipts increased <strong>to</strong> 450 million US$ in <strong>the</strong> 1980’s and 570 million US$ in <strong>the</strong> 1990’s.<br />
Between 2000 and 2007 <strong>the</strong> figure decreased <strong>to</strong> approximately 370 million US$ 103 .<br />
Figure 16 Net ODA (excluding net debt relief) and Net <strong>Debt</strong> <strong>Relief</strong>, at constant 2006 prices,<br />
1994-2007:<br />
Constant Prices, 2006 Million US $<br />
1400<br />
1200<br />
1000<br />
800<br />
600<br />
400<br />
200<br />
0<br />
-200<br />
1994<br />
1995<br />
1996<br />
ODA Total, excl. <strong>Debt</strong><br />
1997<br />
1998<br />
1990<br />
Memo: Net debt relief<br />
Source: Development Assistance Committee (DAC)<br />
2000<br />
101 The year 2000 is used for <strong>the</strong> calculation <strong>of</strong> <strong>the</strong> two averages, <strong>to</strong> make <strong>the</strong> averages overlap.<br />
102 The data on debt relief for Cameroon becomes annually continuous only in 1994 (we have one data in 1990 and<br />
1991, but no data before), so we do not have enough information <strong>to</strong> compute any robust and statistically<br />
significant correlation. When we regress ODA (excluding debt relief) on debt relief, we know that <strong>the</strong>re are a lot<br />
<strong>of</strong> possible problems (i.e. endogeneity, causality, lack <strong>of</strong> control variables, <strong>to</strong>o few data…), but <strong>the</strong> sign <strong>of</strong> <strong>the</strong><br />
coefficient is negative.<br />
103 We used a t-test <strong>to</strong> see if <strong>the</strong> mean <strong>of</strong> ODA between 1990 and 1999 and between 2000 and 2007 received by<br />
Cameroon was statistically different, and <strong>the</strong> test showed us it is effectively <strong>the</strong> case.<br />
2001<br />
2002<br />
2003<br />
2004<br />
2005<br />
2006<br />
2007<br />
Average ODA (94-00) Average ODA (94-00)<br />
| 193 |