October 2006 Volume 9 Number 4
October 2006 Volume 9 Number 4
October 2006 Volume 9 Number 4

Create successful ePaper yourself
Turn your PDF publications into a flip-book with our unique Google optimized e-Paper software.
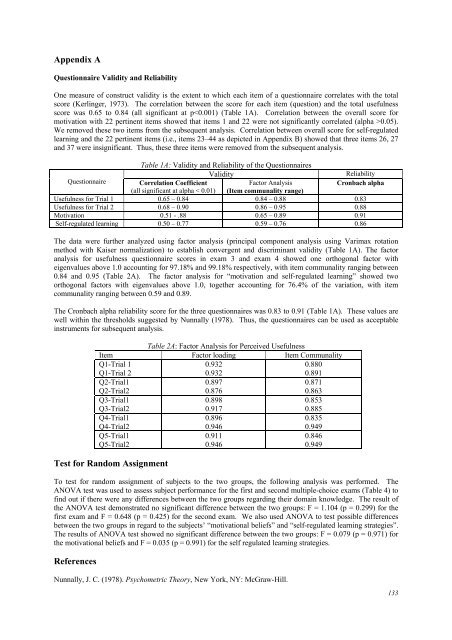
Appendix A<br />
Questionnaire Validity and Reliability<br />
One measure of construct validity is the extent to which each item of a questionnaire correlates with the total<br />
score (Kerlinger, 1973). The correlation between the score for each item (question) and the total usefulness<br />
score was 0.65 to 0.84 (all significant at p0.05).<br />
We removed these two items from the subsequent analysis. Correlation between overall score for self-regulated<br />
learning and the 22 pertinent items (i.e., items 23–44 as depicted in Appendix B) showed that three items 26, 27<br />
and 37 were insignificant. Thus, these three items were removed from the subsequent analysis.<br />
Table 1A: Validity and Reliability of the Questionnaires<br />
Validity<br />
Reliability<br />
Questionnaire Correlation Coefficient<br />
Factor Analysis<br />
Cronbach alpha<br />
(all significant at alpha < 0.01) (Item communality range)<br />
Usefulness for Trial 1 0.65 – 0.84 0.84 – 0.88 0.83<br />
Usefulness for Trial 2 0.68 – 0.90 0.86 – 0.95 0.88<br />
Motivation 0.51 - .88 0.65 – 0.89 0.91<br />
Self-regulated learning 0.50 – 0.77 0.59 – 0.76 0.86<br />
The data were further analyzed using factor analysis (principal component analysis using Varimax rotation<br />
method with Kaiser normalization) to establish convergent and discriminant validity (Table 1A). The factor<br />
analysis for usefulness questionnaire scores in exam 3 and exam 4 showed one orthogonal factor with<br />
eigenvalues above 1.0 accounting for 97.18% and 99.18% respectively, with item communality ranging between<br />
0.84 and 0.95 (Table 2A). The factor analysis for “motivation and self-regulated learning” showed two<br />
orthogonal factors with eigenvalues above 1.0, together accounting for 76.4% of the variation, with item<br />
communality ranging between 0.59 and 0.89.<br />
The Cronbach alpha reliability score for the three questionnaires was 0.83 to 0.91 (Table 1A). These values are<br />
well within the thresholds suggested by Nunnally (1978). Thus, the questionnaires can be used as acceptable<br />
instruments for subsequent analysis.<br />
Table 2A: Factor Analysis for Perceived Usefulness<br />
Item Factor loading Item Communality<br />
Q1-Trial 1<br />
0.932<br />
0.880<br />
Q1-Trial 2<br />
0.932<br />
0.891<br />
Q2-Trial1<br />
0.897<br />
0.871<br />
Q2-Trial2<br />
0.876<br />
0.863<br />
Q3-Trial1<br />
0.898<br />
0.853<br />
Q3-Trial2<br />
0.917<br />
0.885<br />
Q4-Trial1<br />
0.896<br />
0.835<br />
Q4-Trial2<br />
0.946<br />
0.949<br />
Q5-Trial1<br />
0.911<br />
0.846<br />
Q5-Trial2<br />
0.946<br />
0.949<br />
Test for Random Assignment<br />
To test for random assignment of subjects to the two groups, the following analysis was performed. The<br />
ANOVA test was used to assess subject performance for the first and second multiple-choice exams (Table 4) to<br />
find out if there were any differences between the two groups regarding their domain knowledge. The result of<br />
the ANOVA test demonstrated no significant difference between the two groups: F = 1.104 (p = 0.299) for the<br />
first exam and F = 0.648 (p = 0.425) for the second exam. We also used ANOVA to test possible differences<br />
between the two groups in regard to the subjects’ “motivational beliefs” and “self-regulated learning strategies”.<br />
The results of ANOVA test showed no significant difference between the two groups: F = 0.079 (p = 0.971) for<br />
the motivational beliefs and F = 0.035 (p = 0.991) for the self regulated learning strategies.<br />
References<br />
Nunnally, J. C. (1978). Psychometric Theory, New York, NY: McGraw-Hill.<br />
133