October 2006 Volume 9 Number 4
October 2006 Volume 9 Number 4
October 2006 Volume 9 Number 4

Create successful ePaper yourself
Turn your PDF publications into a flip-book with our unique Google optimized e-Paper software.
For each column in Table 2, the sum of the discussion counts placed under the aforementioned categories need<br />
not coincide with the total number of ideas, since those categories are not mutually exclusive, but also because a<br />
few ideas (approximately 10% of the total number over the seven course editions) directly show up as started<br />
projects, without going through a discussion between students and instructors.<br />
After this due premiss, a quick look at the data in Table 2 immediately reveals that the by far most frequent<br />
reason for discussion has to do with the educational orientation, whose lack or unclarity affects almost a half of<br />
the ideas. Refinement of the functional content of the idea takes the second place, finally followed by orientation<br />
with respect to quality objectives. This one featured a rapidly growing trend until the previous course edition,<br />
which fact may be explained by the growing importance given by the instructors to quality objectives, in the<br />
course of time. The exploitment of project idea discussions as an opportunity to build up the project team<br />
exhibits a steadily growing trend throughout the whole sequence of course editions.<br />
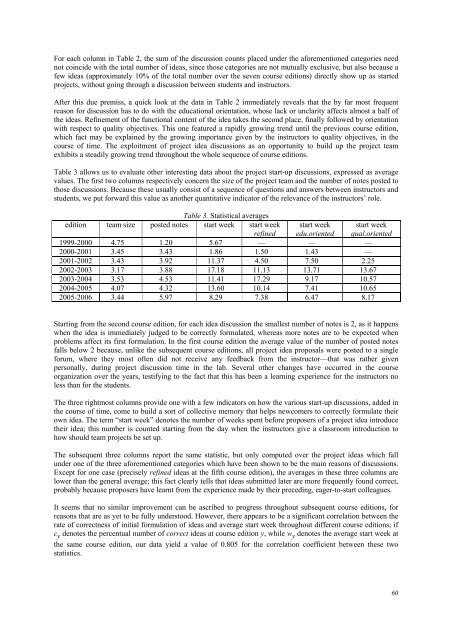
Table 3 allows us to evaluate other interesting data about the project start-up discussions, expressed as average<br />
values. The first two columns respectively concern the size of the project team and the number of notes posted to<br />
those discussions. Because these usually consist of a sequence of questions and answers between instructors and<br />
students, we put forward this value as another quantitative indicator of the relevance of the instructors’ role.<br />
Table 3. Statistical averages<br />
edition team size posted notes start week start week start week start week<br />
refined edu.oriented qual.oriented<br />
1999-2000 4.75 1.20 5.67 — — —<br />
2000-2001 3.45 3.43 1.86 1.50 1.43 —<br />
2001-2002 3.43 3.92 11.37 4.50 7.50 2.25<br />
2002-2003 3.17 3.88 17.18 11.13 13.71 13.67<br />
2003-2004 3.53 4.53 11.41 17.29 9.17 10.57<br />
2004-2005 4.07 4.32 13.60 10.14 7.41 10.65<br />
2005-<strong>2006</strong> 3.44 5.97 8.29 7.38 6.47 8.17<br />
Starting from the second course edition, for each idea discussion the smallest number of notes is 2, as it happens<br />
when the idea is immediately judged to be correctly formulated, whereas more notes are to be expected when<br />
problems affect its first formulation. In the first course edition the average value of the number of posted notes<br />
falls below 2 because, unlike the subsequent course editions, all project idea proposals were posted to a single<br />
forum, where they most often did not receive any feedback from the instructor—that was rather given<br />
personally, during project discussion time in the lab. Several other changes have occurred in the course<br />
organization over the years, testifying to the fact that this has been a learning experience for the instructors no<br />
less than for the students.<br />
The three rightmost columns provide one with a few indicators on how the various start-up discussions, added in<br />
the course of time, come to build a sort of collective memory that helps newcomers to correctly formulate their<br />
own idea. The term “start week” denotes the number of weeks spent before proposers of a project idea introduce<br />
their idea; this number is counted starting from the day when the instructors give a classroom introduction to<br />
how should team projects be set up.<br />
The subsequent three columns report the same statistic, but only computed over the project ideas which fall<br />
under one of the three aforementioned categories which have been shown to be the main reasons of discussions.<br />
Except for one case (precisely refined ideas at the fifth course edition), the averages in these three columns are<br />
lower than the general average; this fact clearly tells that ideas submitted later are more frequently found correct,<br />
probably because proposers have learnt from the experience made by their preceding, eager-to-start colleagues.<br />
It seems that no similar improvement can be ascribed to progress throughout subsequent course editions, for<br />
reasons that are as yet to be fully understood. However, there appears to be a significant correlation between the<br />
rate of correctness of initial formulation of ideas and average start week throughout different course editions; if<br />
c y denotes the percentual number of correct ideas at course edition y, while w y denotes the average start week at<br />
the same course edition, our data yield a value of 0.805 for the correlation coefficient between these two<br />
statistics.<br />
60