October 2006 Volume 9 Number 4
October 2006 Volume 9 Number 4
October 2006 Volume 9 Number 4

Create successful ePaper yourself
Turn your PDF publications into a flip-book with our unique Google optimized e-Paper software.
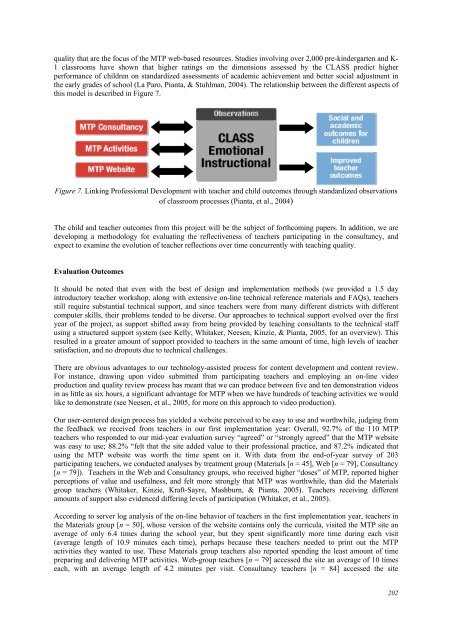
quality that are the focus of the MTP web-based resources. Studies involving over 2,000 pre-kindergarten and K-<br />
1 classrooms have shown that higher ratings on the dimensions assessed by the CLASS predict higher<br />
performance of children on standardized assessments of academic achievement and better social adjustment in<br />
the early grades of school (La Paro, Pianta, & Stuhlman, 2004). The relationship between the different aspects of<br />
this model is described in Figure 7.<br />
Figure 7. Linking Professional Development with teacher and child outcomes through standardized observations<br />
of classroom processes (Pianta, et al., 2004)<br />
The child and teacher outcomes from this project will be the subject of forthcoming papers. In addition, we are<br />
developing a methodology for evaluating the reflectiveness of teachers participating in the consultancy, and<br />
expect to examine the evolution of teacher reflections over time concurrently with teaching quality.<br />
Evaluation Outcomes<br />
It should be noted that even with the best of design and implementation methods (we provided a 1.5 day<br />
introductory teacher workshop, along with extensive on-line technical reference materials and FAQs), teachers<br />
still require substantial technical support, and since teachers were from many different districts with different<br />
computer skills, their problems tended to be diverse. Our approaches to technical support evolved over the first<br />
year of the project, as support shifted away from being provided by teaching consultants to the technical staff<br />
using a structured support system (see Kelly, Whitaker, Neesen, Kinzie, & Pianta, 2005, for an overview). This<br />
resulted in a greater amount of support provided to teachers in the same amount of time, high levels of teacher<br />
satisfaction, and no dropouts due to technical challenges.<br />
There are obvious advantages to our technology-assisted process for content development and content review.<br />
For instance, drawing upon video submitted from participating teachers and employing an on-line video<br />
production and quality review process has meant that we can produce between five and ten demonstration videos<br />
in as little as six hours, a significant advantage for MTP when we have hundreds of teaching activities we would<br />
like to demonstrate (see Neesen, et al., 2005, for more on this approach to video production).<br />
Our user-centered design process has yielded a website perceived to be easy to use and worthwhile, judging from<br />
the feedback we received from teachers in our first implementation year: Overall, 92.7% of the 110 MTP<br />
teachers who responded to our mid-year evaluation survey “agreed” or “strongly agreed” that the MTP website<br />
was easy to use; 88.2% “felt that the site added value to their professional practice, and 87.2% indicated that<br />
using the MTP website was worth the time spent on it. With data from the end-of-year survey of 203<br />
participating teachers, we conducted analyses by treatment group (Materials [n = 45], Web [n = 79], Consultancy<br />
[n = 79]). Teachers in the Web and Consultancy groups, who received higher “doses” of MTP, reported higher<br />
perceptions of value and usefulness, and felt more strongly that MTP was worthwhile, than did the Materials<br />
group teachers (Whitaker, Kinzie, Kraft-Sayre, Mashburn, & Pianta, 2005). Teachers receiving different<br />
amounts of support also evidenced differing levels of participation (Whitaker, et al., 2005).<br />
According to server log analysis of the on-line behavior of teachers in the first implementation year, teachers in<br />
the Materials group [n = 50], whose version of the website contains only the curricula, visited the MTP site an<br />
average of only 6.4 times during the school year, but they spent significantly more time during each visit<br />
(average length of 10.9 minutes each time), perhaps because these teachers needed to print out the MTP<br />
activities they wanted to use. These Materials group teachers also reported spending the least amount of time<br />
preparing and delivering MTP activities. Web-group teachers [n = 79] accessed the site an average of 10 times<br />
each, with an average length of 4.2 minutes per visit. Consultancy teachers [n = 84] accessed the site<br />
202