

Annual Report 2010 - SBM Offshore
Annual Report 2010 - SBM Offshore
Annual Report 2010 - SBM Offshore

Create successful ePaper yourself
Turn your PDF publications into a flip-book with our unique Google optimized e-Paper software.
Non-allocated “Other” income and expenses showed<br />
a net cost of US$ 34.1 million in <strong>2010</strong>, compared with<br />
US$ 31.3 million in 2009.<br />
Net financing costs at US$ 83.7 million were 40%<br />
higher than in 2009 (US$ 60.0 million) mainly as a<br />
result of the Deep Panuke project interest rate hedge<br />
which became partially ineffective (value of hedge<br />
contract exceeded underlying interest rate exposure)<br />
as reported in the mid-year financial statements. This<br />
meant that the (negative) market value of the ineffective<br />
part of the hedge contract at that time had to be<br />
charged directly to the income statement (non-cash<br />
item). In the latter part of the year the realised interest<br />
cost of the overhedged portion has also been charged<br />
to the income statement. Total impact in the <strong>2010</strong><br />
results from this item amounts to US$ 22 million. Net<br />
financing costs were however favourably impacted by a<br />
non-recurring release of provisions related to financing<br />
of the Paenal Yard (US$ 9.0 million), upon divestment of<br />
20% of the Company’s shareholding.<br />
More generally once production units are brought<br />
into service the financing costs are expensed to P&L<br />
(whereas during construction interest is capitalised).<br />
It should be emphasised that the net profit contribution<br />
of newly operational leased units is limited by the<br />
relatively high interest burden during the first years of<br />
operation, although dedication of lease revenues to<br />
debt servicing leads to fast amortisation of the loan<br />
balances and hence reduced interest charges going<br />
forward.<br />
Interest income was low in <strong>2010</strong> with the extremely low<br />
level of short-term US interest rates.<br />
Net financing costs also include currency variances<br />
resulting from project and overhead hedges. These currency<br />
variances were much higher in <strong>2010</strong> than in 2009<br />
(US$ 13.8 million vs US$ 0.3 million for prior year) due<br />
to differences in actual currency expenditure in certain<br />
projects compared to original (hedged) expectations.<br />
This led to enhanced project results (within gross margin)<br />
but higher financial costs.<br />
The reported Share of profit in associates was nil in<br />
<strong>2010</strong>. In the future the Company’s share of net results<br />
in non-controlled joint ventures is likely to appear in<br />
this line item, but at the current time the Company’s<br />
accounting policy for such joint ventures continues to<br />
be the proportionate consolidation method whereby the<br />
Company’s share of each income statement or balance<br />
sheet line item is included in the consolidated financial<br />
statements.<br />
Income tax in <strong>2010</strong> was US$ 2.65 million (1.0% of<br />
pre-tax profit), reflecting significant losses in the<br />
Dutch operations of the Company, the recognition of a<br />
research tax credit in the U.S. and the relatively low tax<br />
burden elsewhere. This compares to a net tax burden<br />
of US$ 3.7 million (1.6% of pre-tax profit) in 2009. The<br />
corporate tax burden excludes deemed profit taxes and<br />
withholding taxes levied outside each group company’s<br />
country of incorporation, which are considered to be<br />
project costs and reported within cost of sales. In <strong>2010</strong><br />
these taxes amounted to US$ 33 million (2009: US$ 29<br />
million).<br />
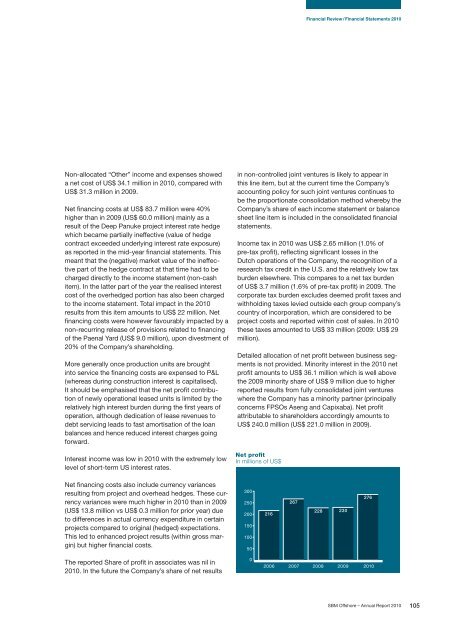
Detailed allocation of net profit between business segments<br />
is not provided. Minority interest in the <strong>2010</strong> net<br />
profit amounts to US$ 36.1 million which is well above<br />
the 2009 minority share of US$ 9 million due to higher<br />
reported results from fully consolidated joint ventures<br />
where the Company has a minority partner (principally<br />
concerns FPSOs Aseng and Capixaba). Net profit<br />
attributable to shareholders accordingly amounts to<br />
US$ 240.0 million (US$ 221.0 million in 2009).<br />
Net profit<br />
In millions of US$<br />
FPSO Serpentina Sale<br />
300<br />
250<br />
200<br />
150<br />
100<br />
50<br />
0<br />
216<br />
267<br />
Financial Review / Financial Statements <strong>2010</strong><br />
228<br />
230<br />
276<br />
2006 2007 2008 2009 <strong>2010</strong><br />
<strong>SBM</strong> <strong>Offshore</strong> – <strong>Annual</strong> <strong>Report</strong> <strong>2010</strong> 105


