

Annual Report 2010 - SBM Offshore
Annual Report 2010 - SBM Offshore
Annual Report 2010 - SBM Offshore

You also want an ePaper? Increase the reach of your titles
YUMPU automatically turns print PDFs into web optimized ePapers that Google loves.
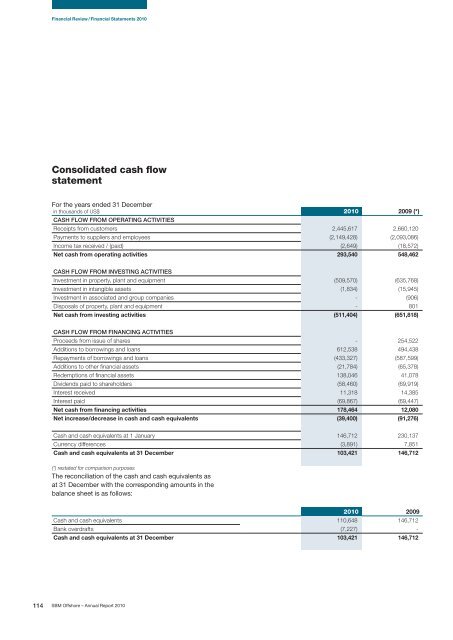
Financial Review / Financial Statements <strong>2010</strong><br />
Consolidated cash flow<br />
statement<br />
For the years ended 31 December<br />
in thousands of US$<br />
CASH FLOW FROM OPERATING ACTIVITIES<br />
<strong>2010</strong> 2009 (*)<br />
Receipts from customers 2,445,617 2,660,120<br />
Payments to suppliers and employees (2,149,428) (2,093,086)<br />
Income tax received / (paid) (2,649) (18,572)<br />
Net cash from operating activities 293,540 548,462<br />
CASH FLOW FROM INVESTING ACTIVITIES<br />
Investment in property, plant and equipment (509,570) (635,768)<br />
Investment in intangible assets (1,834) (15,945)<br />
Investment in associated and group companies - (906)<br />
Disposals of property, plant and equipment - 801<br />
Net cash from investing activities (511,404) (651,818)<br />
CASH FLOW FROM FINANCING ACTIVITIES<br />
Proceeds from issue of shares - 254,522<br />
Additions to borrowings and loans 612,538 494,438<br />
Repayments of borrowings and loans (433,327) (587,599)<br />
Additions to other financial assets (21,784) (65,378)<br />
Redemptions of financial assets 138,046 41,078<br />
Dividends paid to shareholders (58,460) (69,919)<br />
Interest received 11,318 14,385<br />
Interest paid (69,867) (69,447)<br />
Net cash from financing activities 178,464 12,080<br />
Net increase/decrease in cash and cash equivalents (39,400) (91,276)<br />
Cash and cash equivalents at 1 January 146,712 230,137<br />
Currency differences (3,891) 7,851<br />
Cash and cash equivalents at 31 December 103,421 146,712<br />
(*) restated for comparison purposes<br />
The reconciliation of the cash and cash equivalents as<br />
at 31 December with the corresponding amounts in the<br />
balance sheet is as follows:<br />
<strong>2010</strong> 2009<br />
Cash and cash equivalents 110,648 146,712<br />
Bank overdrafts (7,227) -<br />
Cash and cash equivalents at 31 December 103,421 146,712<br />
114 <strong>SBM</strong> <strong>Offshore</strong> – <strong>Annual</strong> <strong>Report</strong> <strong>2010</strong>


