
Create successful ePaper yourself
Turn your PDF publications into a flip-book with our unique Google optimized e-Paper software.
Anisotropic fluctuations in a turbulent boundary layer<br />
B. Jacob ∗ , C. M. Casciola † , A. Talamelli ‡ and P. H. Alfredsson §<br />
The aim of the present work is an experimental investigation of both large- and<br />
small-scale turbulent properties of the boundary layer over a flat plate at Reθ ≈<br />
15000. We focus on the scaling behaviour of the two-points correlation tensor of<br />
order p, defined by: S (p)<br />
α1...αn(r) =〈 δuα1(r) ... δuαn(r)〉, at different distances from<br />
the wall. By projecting each component of the tensor on the so-called sectors of the<br />
group of rotations SO(3), it is possible to extract the isotropic contribution and<br />
to distinguish between different kinds of anisotropies. The contribution from the<br />
isotropic sector is completely described throughout the entire inner region by two<br />
sets of universal exponents, pertaining respectively to the small- and the large-scale<br />
ranges 1 . Preliminary measurements 2 seem to suggest a similar behaviour also for the<br />
pure anisotropic terms of the correlation tensor, like S111112(r3) orS111222(r3). A first<br />
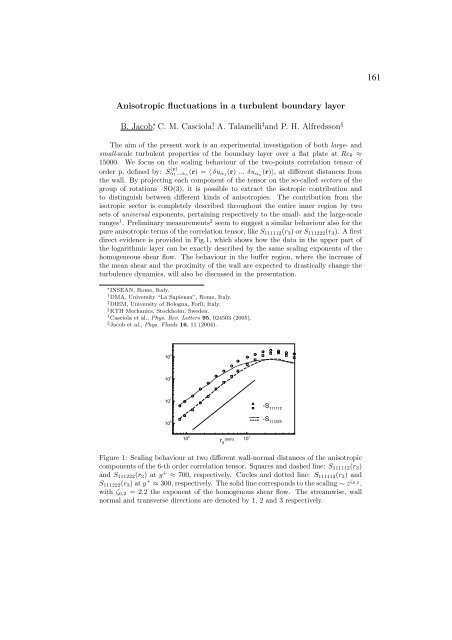
direct evidence is provided in Fig.1, which shows how the data in the upper part of<br />
the logarithmic layer can be exactly described by the same scaling exponents of the<br />
homogeneous shear flow. The behaviour in the buffer region, where the increase of<br />
the mean shear and the proximity of the wall are expected to drastically change the<br />
turbulence dynamics, will also be discussed in the presentation.<br />
∗ INSEAN, Rome, Italy.<br />
† DMA, University “La Sapienza”, Rome, Italy.<br />
‡ DIEM, University of Bologna, Forlì, Italy.<br />
§ <strong>KTH</strong> <strong>Mechanics</strong>, Stockholm, Sweden.<br />
1 Casciola et al., Phys. Rev. Letters 95, 024503 (2005).<br />
2 Jacob et al., Phys. Fluids 16, 11 (2004).<br />
10 3<br />
10 2<br />
10 1<br />
10 0<br />
10 0<br />
r (mm)<br />
3<br />
10 1<br />
-S 111112<br />
-S 111222<br />
Figure 1: Scaling behaviour at two different wall-normal distances of the anisotropic<br />
components of the 6-th order correlation tensor. Squares and dashed line: S111112(r3)<br />
and S111222(r3) aty + ≈ 700, respectively. Circles and dotted line: S111112(r3) and<br />
S111222(r3)aty + ≈ 300, respectively. The solid line corresponds to the scaling ∼ z ζ6,2 ,<br />
with ζ6,2 =2.2 the exponent of the homogenous shear flow. The streamwise, wall<br />
normal and transverse directions are denoted by 1, 2 and 3 respectively.<br />
161