
Create successful ePaper yourself
Turn your PDF publications into a flip-book with our unique Google optimized e-Paper software.
40<br />
Experimental and Theoretical Investigation into the Development<br />
of Turbulent Spots under Varying Pressure Gradient<br />
D. M. Hernon a, E. J. Walsh a, D. M. McEligot b<br />
Recent DNS studies on zero pressure gradient flow have elucidated the precursors<br />
to turbulent spot production; however, experimental and analytical techniques are not<br />
capable of reproducing such detailed results. The capability of DNS to trace back in<br />
time to the exact initiation of a turbulent spot can not be achieved in practice.<br />
Therefore, in order to gain a similar level of insight into the transition process the<br />
experimenter has to take a considered approach to the methodology of testing.<br />
Furthermore, within the literature little information exists on the generation of<br />
turbulent spots in both positive and adverse pressure gradients.<br />
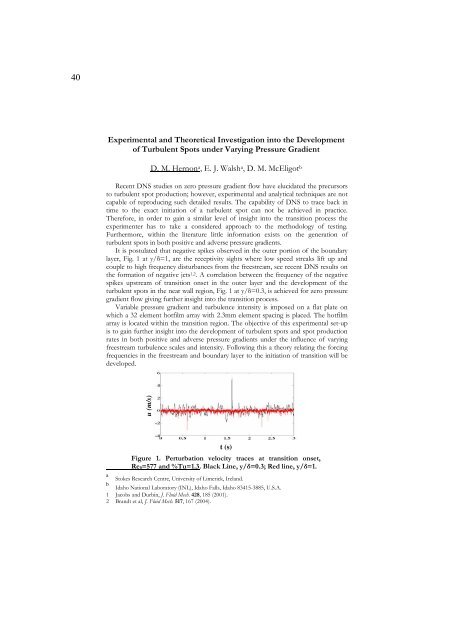
It is postulated that negative spikes observed in the outer portion of the boundary<br />
layer, Fig. 1 at y/δ=1, are the receptivity sights where low speed streaks lift up and<br />
couple to high frequency disturbances from the freestream, see recent DNS results on<br />
the formation of negative jets 1,2. A correlation between the frequency of the negative<br />
spikes upstream of transition onset in the outer layer and the development of the<br />
turbulent spots in the near wall region, Fig. 1 at y/δ=0.3, is achieved for zero pressure<br />
gradient flow giving further insight into the transition process.<br />
Variable pressure gradient and turbulence intensity is imposed on a flat plate on<br />
which a 32 element hotfilm array with 2.3mm element spacing is placed. The hotfilm<br />
array is located within the transition region. The objective of this experimental set-up<br />
is to gain further insight into the development of turbulent spots and spot production<br />
rates in both positive and adverse pressure gradients under the influence of varying<br />
freestream turbulence scales and intensity. Following this a theory relating the forcing<br />
frequencies in the freestream and boundary layer to the initiation of transition will be<br />
developed.<br />
u (m/s)<br />
t (s)<br />
Figure 1. Perturbation velocity traces at transition onset,<br />
Reθ=577 and %Tu=1.3. Black Line, y/δ=0.3; Red line, y/δ=1.<br />
a<br />
Stokes Research Centre, University of Limerick, Ireland.<br />
b<br />
Idaho National Laboratory (INL), Idaho Falls, Idaho 83415-3885, U.S.A.<br />
1 Jacobs and Durbin, J. Fluid Mech. 428, 185 (2001).<br />
2 Brandt et al, J. Fluid Mech. 517, 167 (2004).