
Create successful ePaper yourself
Turn your PDF publications into a flip-book with our unique Google optimized e-Paper software.
72<br />
Experimental study on the boundary layer transition induced<br />
by a shallow 3D roughness element<br />
I. B. de Paula ∗† ,M.A.F.deMedeiros ∗ ,W.Würz † , M. T. Mendonça ‡<br />
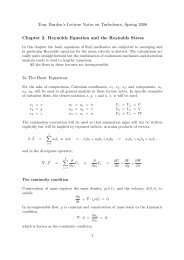
The influence of shallow 3-D roughness element on the evolution of a 2-D Tollmien-<br />
Schlichting wave was studied experimentally. The current measurements were carried<br />
out in a Blasius boundary layer. The cylindrical roughness element used was oscillated<br />
slowly as a quasi-steady disturbance. Therefore, the hot wire signal could be ensemble<br />
averaged in order to reduce the experimental noise. In the present work the 2-D<br />
wave was excited artificially with 2 different amplitudes. These amplitudes were<br />
selected according with numerical simulations provided by a PSE code. Thus, it<br />
was possible to select previously the bandwidth of oblique waves amplified by the<br />
fundamental resonance mechanism. Using this approach was possible to check how<br />
shallow roughness elements can affect the boundary layer transition. For roughness<br />
heights below 0.25δ ∗ , the bandwidth of amplified oblique waves observed downstream<br />
was in good agreement with the one predicted by secondary instability theory. For<br />
roughness higher than 0.25δ ∗ the distribution of oblique modes amplitudes and growth<br />
started to deviate significantly from prediction. The results show that the value of<br />
critical roughness height which can affect the boundary layer transition is dependent<br />
of the threshold for self sustained k-type transition. These observations suggests that<br />
critical roughness height which can affect the boundary layer transition is dependent<br />
not only of the boundary layer thickness but also of TS wave amplitude.<br />
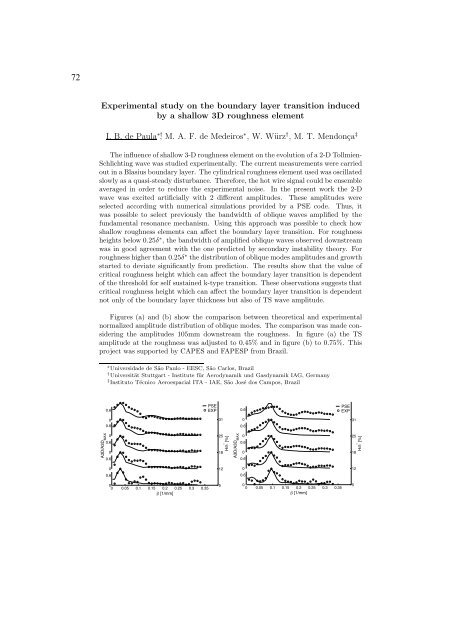
Figures (a) and (b) show the comparison between theoretical and experimental<br />
normalized amplitude distribution of oblique modes. The comparison was made considering<br />
the amplitudes 105mm downstream the roughness. In figure (a) the TS<br />
amplitude at the roughness was adjusted to 0.45% and in figure (b) to 0.75%. This<br />
project was supported by CAPES and FAPESP from Brazil.<br />
A3D/A3D MAX<br />
∗ Universidade de São Paulo - EESC, São Carlos, Brazil<br />
† Universität Stuttgart - Institute für Aerodynamik und Gasdynamik IAG, Germany<br />
‡ Instituto Técnico Aeroespacial ITA - IAE, São José dos Campos, Brazil<br />
0.6<br />
0<br />
0.6<br />
0<br />
0.6<br />
0<br />
0.6<br />
0<br />
0.6<br />
PSE<br />
o EXP<br />
0<br />
0 0.05 0.1 0.15 0.2<br />
β [1/mm]<br />
0.25 0.3 0.35<br />
31<br />
25<br />
18<br />
12<br />
5<br />
H/δ * [%]<br />
A3D/A3D MAX<br />
0.6<br />
0<br />
0.6<br />
0<br />
0.6<br />
0<br />
0.6<br />
0<br />
0.6<br />
0<br />
0 0.05 0.1 0.15 0.2<br />
β [1/mm]<br />
0.25 0.3 0.35<br />
PSE<br />
o EXP<br />
31<br />
25<br />
18<br />
12<br />
5<br />
H/δ * [%]