
You also want an ePaper? Increase the reach of your titles
YUMPU automatically turns print PDFs into web optimized ePapers that Google loves.
Combined Velocity and Temperature Measurement in a Buoyancy<br />
Induced Ring Vortex<br />
S.M.M. Salim a , J.G.C. Kunnen a , C.C.M. Rindt a and A.A. v. Steenhoven a<br />
A combined velocity and temperature measurement in a buoyancy induced<br />
vortex ring was conducted. The vortex ring was produced by a droplet of<br />
Rhodemine B solution falling into a small tank filled with a solution of equal<br />
concentration but higher temperature. The main target was to test the accuracy of a<br />
combined velocity and temperature measurement technique using a pulsed laser.<br />
Additionally, a dye-visualization was conducted to understand the formation process<br />
of the ring vortex.<br />
The experimental setup consists of a small tank filled with a Rhodamine B<br />
solution (1.0×10<br />
10<br />
1<br />
20<br />
-4 mol/m 3 ) seeded with hollow spherical 10µm particles. A 29 Hz<br />
single pulsed Nd:YAG laser (532nm wavelength) was used as a lightsource. A 1.0 mm<br />
thick light sheet was created. Two 10-bit CCD cameras were used to capture the PTV<br />
and LIF images. A high pass filter of 532nm was put in front of the camera which<br />
captures the LIF signal emitted by the Rhodamine B (wavelength around 575nm) in<br />
order to block the light intensity scattered by the particles.<br />
To obtain the temperature field an innovative correction method was developed<br />
to correct for the spatio-temporal variations of the Nd:YAG laser intensity. The<br />
correction is local and based on a correction line by line. The method requires<br />
knowledge of the temperature field in part of the image.<br />
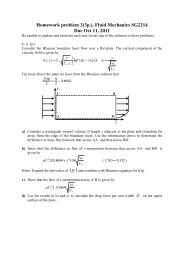
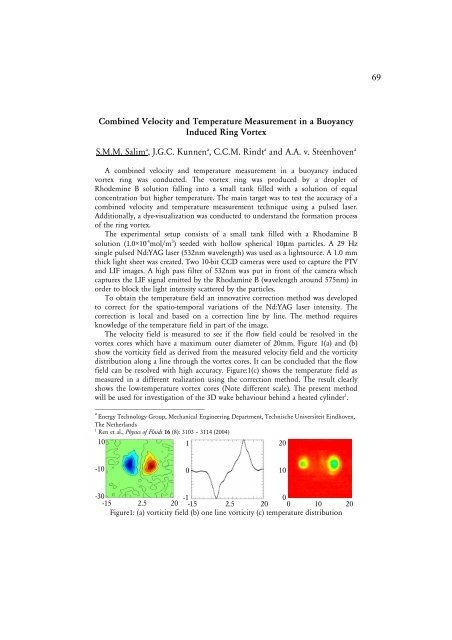
The velocity field is measured to see if the flow field could be resolved in the<br />
vortex cores which have a maximum outer diameter of 20mm. Figure 1(a) and (b)<br />
show the vorticity field as derived from the measured velocity field and the vorticity<br />
distribution along a line through the vortex cores. It can be concluded that the flow<br />
field can be resolved with high accuracy. Figure:1(c) shows the temperature field as<br />
measured in a different realization using the correction method. The result clearly<br />
shows the low-temperature vortex cores (Note different scale). The present method<br />
will be used for investigation of the 3D wake behaviour behind a heated cylinder 1 .<br />
____________________________<br />
a<br />
Energy Technology Group, Mechanical Engineering Department, Technische Universiteit Eindhoven,<br />
The Netherlands<br />
1 Ren et al., Physics of Fluids 16 (8): 3103 – 3114 (2004)<br />
-10<br />
0<br />
-30<br />
-1<br />
0<br />
-15 2.5 20 -15 2.5 20 0 10 20<br />
Figure1: (a) vorticity field (b) one line vorticity (c) temperature distribution<br />
10<br />
69