
Create successful ePaper yourself
Turn your PDF publications into a flip-book with our unique Google optimized e-Paper software.
Low-speed streaks developing at the laminar-turbulent interface of<br />
turbulent wedge<br />
A. Inasawa a, Y. Yokosawa a and M. Asai a<br />
Development of low-speed streaks in lateral turbulent contamination in a flat plate<br />
boundary layer is examined experimentally by means of PIV and flow visualization.<br />
We focus on the lateral scale of low-speed streaks successively generated at both sides<br />
of turbulent wedge.<br />
The experiment is conducted in a low turbulence wind tunnel with free-stream<br />
velocity 4 m/s, and turbulent wedge is generated by hairpin eddies introduced through<br />
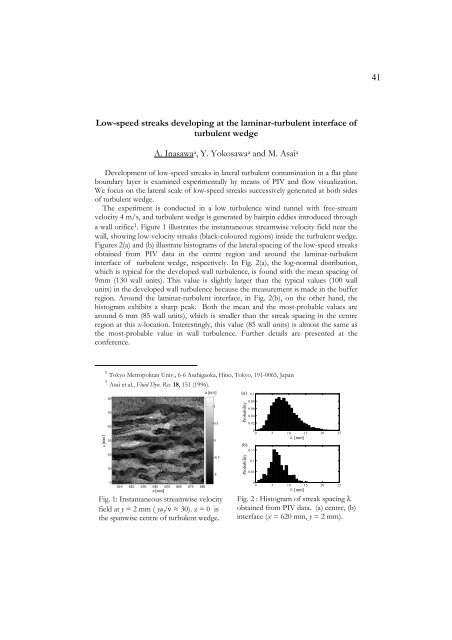
a wall orifice 1 . Figure 1 illustrates the instantaneous streamwise velocity field near the<br />
wall, showing low-velocity streaks (black-coloured regions) inside the turbulent wedge.<br />
Figures 2(a) and (b) illustrate histograms of the lateral spacing of the low-speed streaks<br />
obtained from PIV data in the centre region and around the laminar-turbulent<br />
interface of turbulent wedge, respectively. In Fig. 2(a), the log-normal distribution,<br />
which is typical for the developed wall turbulence, is found with the mean spacing of<br />
9mm (130 wall units). This value is slightly larger than the typical values (100 wall<br />
units) in the developed wall turbulence because the measurement is made in the buffer<br />
region. Around the laminar-turbulent interface, in Fig. 2(b), on the other hand, the<br />
histogram exhibits a sharp peak. Both the mean and the most-probable values are<br />
around 6 mm (85 wall units), which is smaller than the streak spacing in the centre<br />
region at this x-location. Interestingly, this value (85 wall units) is almost the same as<br />
the most-probable value in wall turbulence. Further details are presented at the<br />
conference.<br />
a Tokyo Metropolitan Univ., 6-6 Asahigaoka, Hino, Tokyo, 191-0065, Japan<br />
1 Asai et al., Fluid Dyn. Res. 18, 151 (1996).<br />
Fig. 1: Instantaneous streamwise velocity<br />
field at y = 2 mm ( yu 30). z = 0 is<br />
the spanwise centre of turbulent wedge.<br />
<br />
(a) 0.1<br />
Probability<br />
0.08<br />
0.06<br />
0.04<br />
0.02<br />
0<br />
0 5 10 15 20 25<br />
[mm]<br />
(b)<br />
0.15<br />
Probability<br />
0.1<br />
0.05<br />
0<br />
0 5 10 15 20 25<br />
[mm]<br />
Fig. 2 : Histogram of streak spacing <br />
obtained from PIV data. (a) centre, (b)<br />
interface (x = 620 mm, y = 2 mm).<br />
41