

Download - Opec
Download - Opec
Download - Opec

You also want an ePaper? Increase the reach of your titles
YUMPU automatically turns print PDFs into web optimized ePapers that Google loves.
54<br />
Table Oil and gas data<br />
98<br />
OPEC Annual Statistical Bulletin 2004<br />
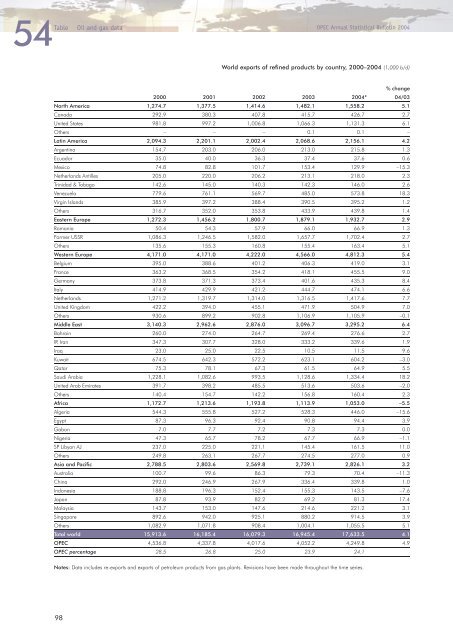
World exports of refined products by country, 2000–2004 (1,000 b/d)<br />
% change<br />
2000 2001 2002 2003 2004* 04/03<br />
North America 1,274.7 1,377.5 1,414.6 1,482.1 1,558.2 5.1<br />
Canada 292.9 380.3 407.8 415.7 426.7 2.7<br />
United States 981.8 997.2 1,006.8 1,066.3 1,131.3 6.1<br />
Others – – – 0.1 0.1 –<br />
Latin America 2,094.3 2,201.1 2,002.4 2,068.6 2,156.1 4.2<br />
Argentina 154.7 203.0 206.0 213.0 215.8 1.3<br />
Ecuador 35.0 40.0 36.3 37.4 37.6 0.6<br />
Mexico 74.8 82.8 101.7 153.4 129.9 –15.3<br />
Netherlands Antilles 205.0 220.0 206.2 213.1 218.0 2.3<br />
Trinidad & Tobago 142.6 145.0 140.3 142.3 146.0 2.6<br />
Venezuela 779.6 761.1 569.7 485.0 573.8 18.3<br />
Virgin Islands 385.9 397.2 388.4 390.5 395.2 1.2<br />
Others 316.7 352.0 353.8 433.9 439.8 1.4<br />
Eastern Europe 1,272.3 1,456.2 1,800.7 1,879.1 1,932.7 2.9<br />
Romania 50.4 54.3 57.9 66.0 66.9 1.3<br />
Former USSR 1,086.3 1,246.5 1,582.0 1,657.7 1,702.4 2.7<br />
Others 135.6 155.3 160.8 155.4 163.4 5.1<br />
Western Europe 4,171.0 4,171.0 4,222.0 4,566.0 4,812.3 5.4<br />
Belgium 395.0 388.6 401.2 406.3 419.0 3.1<br />
France 363.2 368.5 354.2 418.1 455.5 9.0<br />
Germany 373.8 371.3 373.4 401.6 435.3 8.4<br />
Italy 414.9 429.9 421.2 444.7 474.1 6.6<br />
Netherlands 1,271.2 1,319.7 1,314.0 1,316.5 1,417.6 7.7<br />
United Kingdom 422.2 394.0 455.1 471.9 504.9 7.0<br />
Others 930.6 899.2 902.8 1,106.9 1,105.9 –0.1<br />
Middle East 3,140.3 2,962.6 2,876.0 3,096.7 3,295.2 6.4<br />
Bahrain 260.0 274.0 264.7 269.4 276.6 2.7<br />
IR Iran 347.3 307.7 328.0 333.2 339.6 1.9<br />
Iraq 23.0 25.0 22.5 10.5 11.5 9.6<br />
Kuwait 674.5 642.3 572.2 623.1 604.2 –3.0<br />
Qatar 75.3 78.1 67.3 61.5 64.9 5.5<br />
Saudi Arabia 1,228.1 1,082.6 993.5 1,128.6 1,334.4 18.2<br />
United Arab Emirates 391.7 398.2 485.5 513.6 503.6 –2.0<br />
Others 140.4 154.7 142.2 156.8 160.4 2.3<br />
Africa 1,172.7 1,213.6 1,193.8 1,113.9 1,053.0 –5.5<br />
Algeria 544.3 555.8 527.2 528.3 446.0 –15.6<br />
Egypt 87.3 96.3 92.4 90.8 94.4 3.9<br />
Gabon 7.0 7.7 7.2 7.3 7.3 0.0<br />
Nigeria 47.3 65.7 78.2 67.7 66.9 –1.1<br />
SP Libyan AJ 237.0 225.0 221.1 145.4 161.5 11.0<br />
Others 249.8 263.1 267.7 274.5 277.0 0.9<br />
Asia and Pacific 2,788.5 2,803.6 2,569.8 2,739.1 2,826.1 3.2<br />
Australia 100.7 99.6 86.3 79.3 70.4 –11.3<br />
China 292.0 246.9 267.9 336.4 339.8 1.0<br />
Indonesia 188.8 196.3 152.4 155.3 143.5 –7.6<br />
Japan 87.8 93.9 82.2 69.2 81.3 17.4<br />
Malaysia 143.7 153.0 147.6 214.6 221.2 3.1<br />
Singapore 892.6 942.0 925.1 880.2 914.5 3.9<br />
Others 1,082.9 1,071.8 908.4 1,004.1 1,055.5 5.1<br />
Total world 15,913.6 16,185.4 16,079.3 16,945.4 17,633.5 4.1<br />
OPEC 4,536.8 4,337.8 4,017.6 4,052.2 4,249.8 4.9<br />
OPEC percentage 28.5 26.8 25.0 23.9 24.1<br />
Notes: Data includes re-exports and exports of petroleum products from gas plants. Revisions have been made throughout the time series.


