

Download - Opec
Download - Opec
Download - Opec

You also want an ePaper? Increase the reach of your titles
YUMPU automatically turns print PDFs into web optimized ePapers that Google loves.
77<br />
Table Major oil companies OPEC Annual Statistical Bulletin 2004<br />
BP<br />
130<br />
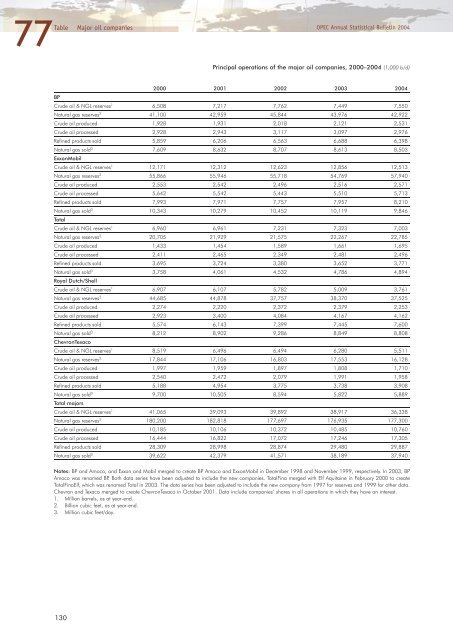
Principal operations of the major oil companies, 2000–2004 (1,000 b/d)<br />
2000 2001 2002 2003 2004<br />
Crude oil & NGL reserves 1 6,508 7,217 7,762 7,449 7,550<br />
Natural gas reserves 2 41,100 42,959 45,844 43,976 42,922<br />
Crude oil produced 1,928 1,931 2,018 2,121 2,531<br />
Crude oil processed 2,928 2,943 3,117 3,097 2,976<br />
Refined products sold 5,859 6,206 6,563 6,688 6,398<br />
Natural gas sold 3 7,609 8,632 8,707 8,613 8,503<br />
ExxonMobil<br />
Crude oil & NGL reserves 1 12,171 12,312 12,623 12,856 12,513<br />
Natural gas reserves 2 55,866 55,946 55,718 54,769 57,940<br />
Crude oil produced 2,553 2,542 2,496 2,516 2,571<br />
Crude oil processed 5,642 5,542 5,443 5,510 5,713<br />
Refined products sold 7,993 7,971 7,757 7,957 8,210<br />
Natural gas sold 3 10,343 10,279 10,452 10,119 9,846<br />
Total<br />
Crude oil & NGL reserves 1 6,960 6,961 7,231 7,323 7,003<br />
Natural gas reserves 2 20,705 21,929 21,575 22,267 22,785<br />
Crude oil produced 1,433 1,454 1,589 1,661 1,695<br />
Crude oil processed 2,411 2,465 2,349 2,481 2,496<br />
Refined products sold 3,695 3,724 3,380 3,652 3,771<br />
Natural gas sold 3 3,758 4,061 4,532 4,786 4,894<br />
Royal Dutch/Shell<br />
Crude oil & NGL reserves 1 6,907 6,107 5,782 5,009 3,761<br />
Natural gas reserves 2 44,685 44,878 37,757 38,370 37,525<br />
Crude oil produced 2,274 2,220 2,372 2,379 2,253<br />
Crude oil processed 2,923 3,400 4,084 4,167 4,162<br />
Refined products sold 5,574 6,143 7,399 7,445 7,600<br />
Natural gas sold 3 8,212 8,902 9,286 8,849 8,808<br />
ChevronTexaco<br />
Crude oil & NGL reserves 1 8,519 6,496 6,494 6,280 5,511<br />
Natural gas reserves 2 17,844 17,106 16,803 17,553 16,128<br />
Crude oil produced 1,997 1,959 1,897 1,808 1,710<br />
Crude oil processed 2,540 2,472 2,079 1,991 1,958<br />
Refined products sold 5,188 4,954 3,775 3,738 3,908<br />
Natural gas sold 3 9,700 10,505 8,594 5,822 5,889<br />
Total majors<br />
Crude oil & NGL reserves 1 41,065 39,093 39,892 38,917 36,338<br />
Natural gas reserves 2 180,200 182,818 177,697 176,935 177,300<br />
Crude oil produced 10,185 10,106 10,372 10,485 10,760<br />
Crude oil processed 16,444 16,822 17,072 17,246 17,305<br />
Refined products sold 28,309 28,998 28,874 29,480 29,887<br />
Natural gas sold 3 39,622 42,379 41,571 38,189 37,940<br />
Notes: BP and Amoco, and Exxon and Mobil merged to create BP Amoco and ExxonMobil in December 1998 and November 1999, respectively. In 2003, BP<br />
Amoco was renamed BP. Both data series have been adjusted to include the new companies. TotalFina merged with Elf Aquitaine in February 2000 to create<br />
TotalFinaElf, which was renamed Total in 2003. The data series has been adjusted to include the new company from 1997 for reserves and 1999 for other data.<br />
Chevron and Texaco merged to create ChevronTexaco in October 2001. Data include companies’ shares in all operations in which they have an interest.<br />
1. Million barrels, as at year-end.<br />
2. Billion cubic feet, as at year-end.<br />
3. Million cubic feet/day.


