

Download - Opec
Download - Opec
Download - Opec

You also want an ePaper? Increase the reach of your titles
YUMPU automatically turns print PDFs into web optimized ePapers that Google loves.
34<br />
Table Oil and gas data<br />
44<br />
OPEC Annual Statistical Bulletin 2004<br />
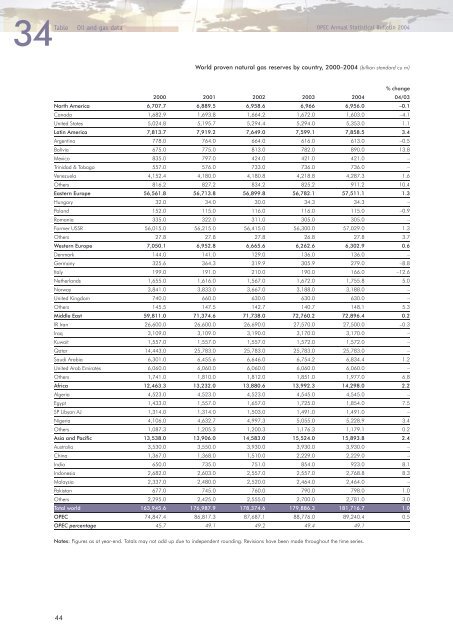
World proven natural gas reserves by country, 2000–2004 (billion standard cu m)<br />
% change<br />
2000 2001 2002 2003 2004 04/03<br />
North America 6,707.7 6,889.5 6,958.6 6,966 6,956.0 –0.1<br />
Canada 1,682.9 1,693.8 1,664.2 1,672.0 1,603.0 –4.1<br />
United States 5,024.8 5,195.7 5,294.4 5,294.0 5,353.0 1.1<br />
Latin America 7,813.7 7,919.2 7,649.0 7,599.1 7,858.5 3.4<br />
Argentina 778.0 764.0 664.0 616.0 613.0 –0.5<br />
Bolivia 675.0 775.0 813.0 782.0 890.0 13.8<br />
Mexico 835.0 797.0 424.0 421.0 421.0 –<br />
Trinidad & Tobago 557.0 576.0 733.0 736.0 736.0 –<br />
Venezuela 4,152.4 4,180.0 4,180.8 4,218.8 4,287.3 1.6<br />
Others 816.2 827.2 834.2 825.2 911.2 10.4<br />
Eastern Europe 56,561.8 56,713.8 56,899.8 56,782.1 57,511.1 1.3<br />
Hungary 32.0 34.0 30.0 34.3 34.3 –<br />
Poland 152.0 115.0 116.0 116.0 115.0 –0.9<br />
Romania 335.0 322.0 311.0 305.0 305.0 –<br />
Former USSR 56,015.0 56,215.0 56,415.0 56,300.0 57,029.0 1.3<br />
Others 27.8 27.8 27.8 26.8 27.8 3.7<br />
Western Europe 7,050.1 6,952.8 6,665.6 6,262.6 6,302.9 0.6<br />
Denmark 144.0 141.0 129.0 136.0 136.0 –<br />
Germany 325.6 364.3 319.9 305.9 279.0 –8.8<br />
Italy 199.0 191.0 210.0 190.0 166.0 –12.6<br />
Netherlands 1,655.0 1,616.0 1,567.0 1,672.0 1,755.8 5.0<br />
Norway 3,841.0 3,833.0 3,667.0 3,188.0 3,188.0 –<br />
United Kingdom 740.0 660.0 630.0 630.0 630.0 –<br />
Others 145.5 147.5 142.7 140.7 148.1 5.3<br />
Middle East 59,811.0 71,374.6 71,738.0 72,760.2 72,896.4 0.2<br />
IR Iran 26,600.0 26,600.0 26,690.0 27,570.0 27,500.0 –0.3<br />
Iraq 3,109.0 3,109.0 3,190.0 3,170.0 3,170.0 –<br />
Kuwait 1,557.0 1,557.0 1,557.0 1,572.0 1,572.0 –<br />
Qatar 14,443.0 25,783.0 25,783.0 25,783.0 25,783.0 –<br />
Saudi Arabia 6,301.0 6,455.6 6,646.0 6,754.2 6,834.4 1.2<br />
United Arab Emirates 6,060.0 6,060.0 6,060.0 6,060.0 6,060.0 –<br />
Others 1,741.0 1,810.0 1,812.0 1,851.0 1,977.0 6.8<br />
Africa 12,463.3 13,232.0 13,880.6 13,992.3 14,298.0 2.2<br />
Algeria 4,523.0 4,523.0 4,523.0 4,545.0 4,545.0 –<br />
Egypt 1,433.0 1,557.0 1,657.0 1,725.0 1,854.0 7.5<br />
SP Libyan AJ 1,314.0 1,314.0 1,503.0 1,491.0 1,491.0 –<br />
Nigeria 4,106.0 4,632.7 4,997.3 5,055.0 5,228.9 3.4<br />
Others 1,087.3 1,205.3 1,200.3 1,176.3 1,179.1 0.2<br />
Asia and Pacific 13,538.0 13,906.0 14,583.0 15,524.0 15,893.8 2.4<br />
Australia 3,530.0 3,550.0 3,930.0 3,930.0 3,930.0 –<br />
China 1,367.0 1,368.0 1,510.0 2,229.0 2,229.0 –<br />
India 650.0 735.0 751.0 854.0 923.0 8.1<br />
Indonesia 2,682.0 2,603.0 2,557.0 2,557.0 2,768.8 8.3<br />
Malaysia 2,337.0 2,480.0 2,520.0 2,464.0 2,464.0 –<br />
Pakistan 677.0 745.0 760.0 790.0 798.0 1.0<br />
Others 2,295.0 2,425.0 2,555.0 2,700.0 2,781.0 3.0<br />
Total world 163,945.6 176,987.9 178,374.6 179,886.3 181,716.7 1.0<br />
OPEC 74,847.4 86,817.3 87,687.1 88,776.0 89,240.4 0.5<br />
OPEC percentage 45.7 49.1 49.2 49.4 49.1<br />
Notes: Figures as at year-end. Totals may not add up due to independent rounding. Revisions have been made throughout the time series.


