Download - Opec
Download - Opec
Download - Opec
You also want an ePaper? Increase the reach of your titles
YUMPU automatically turns print PDFs into web optimized ePapers that Google loves.
53<br />
Table Oil and gas data<br />
96<br />
OPEC Annual Statistical Bulletin 2004<br />
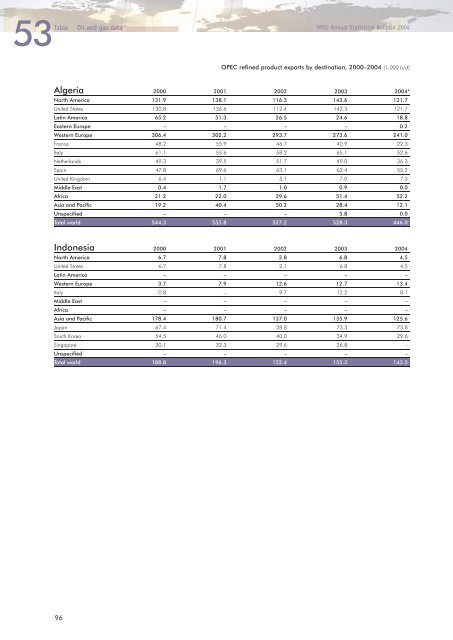
OPEC refined product exports by destination, 2000–2004 (1,000 b/d)<br />
Algeria 2000 2001 2002 2003 2004*<br />
North America 131.9 138.1 116.3 143.6 121.7<br />
United States 130.8 136.6 112.4 142.3 121.7<br />
Latin America 65.2 51.3 26.5 24.6 18.8<br />
Eastern Europe – – – – 0.2<br />
Western Europe 306.4 302.2 293.7 273.6 241.0<br />
France 48.2 55.9 46.7 40.9 22.3<br />
Italy 61.1 55.6 58.2 65.1 52.6<br />
Netherlands 49.3 39.5 51.7 49.0 36.3<br />
Spain 47.8 69.6 63.1 62.4 55.2<br />
United Kingdom 6.4 1.1 5.1 7.0 7.3<br />
Middle East 0.4 1.7 1.0 0.9 0.0<br />
Africa 21.2 22.0 39.6 51.4 52.2<br />
Asia and Pacific 19.2 40.4 50.2 28.4 12.1<br />
Unspecified – – – 5.8 0.0<br />
Total world 544.3 555.8 527.2 528.3 446.0<br />
Indonesia 2000 2001 2002 2003 2004<br />
North America 6.7 7.8 2.8 6.8 4.5<br />
United States 6.7 7.8 2.1 6.8 4.5<br />
Latin America – – – – –<br />
Western Europe 3.7 7.9 12.6 12.7 13.4<br />
Italy 0.8 – 9.7 12.2 8.1<br />
Middle East – – – – –<br />
Africa – – – – –<br />
Asia and Pacific 178.4 180.7 137.0 135.9 125.6<br />
Japan 67.4 71.4 28.8 73.3 73.8<br />
South Korea 54.5 46.0 40.0 34.9 29.6<br />
Singapore 30.1 32.3 29.6 26.8 –<br />
Unspecified – – – – –<br />
Total world 188.8 196.3 152.4 155.3 143.5


