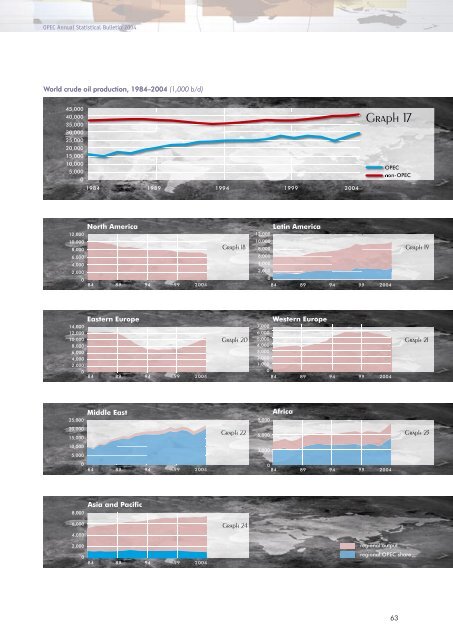
39 Table Oil and gas data 62 OPEC Annual Statistical Bulletin 2004 World crude oil production by country, 2000–2004 (1,000 b/d) % change 2000 2001 2002 2003 2004 04/03 North America 7,213.1 7,178.9 7,191.3 7,140.1 6,835.5 –4.3 Canada 1,391.5 1,377.5 1,445.8 1,459.4 1,405.2 –3.7 USA 5,821.6 5,801.4 5,745.5 5,680.7 5,430.3 –4.4 Latin America 9,303.4 9,319.0 9,463.5 9,544.0 9,928.9 4.0 Argentina 769.2 781.9 755.1 740.8 694.9 –6.2 Brazil 1,231.2 1,292.8 1,454.4 1,496.1 1,477.4 –1.3 Chile 7.2 6.6 5.8 3.9 4.0 2.1 Colombia 687.2 603.7 575.0 541.5 521.2 –3.8 Ecuador 392.0 401.3 391.8 420.4 520.6 23.9 Mexico 3,012.1 3,127.1 3,177.2 3,370.8 3,383.0 0.4 Peru 99.2 94.6 92.5 86.7 80.4 –7.2 Trinidad & Tobago 119.5 113.4 130.6 134.8 127.0 –5.8 Venezuela 2,891.0 2,791.9 2,782.0 2,643.0 3,009.4 13.9 Others 94.6 105.9 99.1 106.0 111.0 4.7 Eastern Europe 7,629.2 8,246.9 9,034.9 9,939.3 10,736.0 8.0 Albania 6.3 6.0 6.0 6.0 6.0 – Hungary 26.9 28.9 24.3 27.2 21.8 –19.7 Romania 118.0 118.4 118.2 114.4 103.0 –9.9 Former USSR 7,459.5 8,072.7 8,865.8 9,769.0 10,580.5 8.3 Others 18.5 21.0 20.6 22.8 24.7 8.5 Western Europe 6,287.5 6,033.6 5,949.6 5,626.6 5,367.4 –4.6 Denmark 362.5 346.7 368.6 369.4 389.2 5.3 France 28.4 27.8 26.4 24.6 22.9 –6.6 Germany 62.3 64.7 69.2 72.8 67.7 –7.1 Italy 74.1 64.0 84.5 90.4 103.9 14.9 Netherlands 28.0 26.6 43.4 44.8 41.2 –8.1 Norway 3,182.8 3,118.0 2,992.4 2,851.5 2,797.4 –1.9 Turkey 52.7 48.5 46.6 45.3 43.7 –3.4 United Kingdom 2,427.1 2,269.3 2,254.3 2,065.8 1,843.0 –10.8 Former Yugoslavia 41.5 39.2 36.1 35.5 33.0 –7.0 Others 28.2 28.8 28.0 26.6 25.5 –4.3 Middle East 21,423.1 20,789.7 18,650.0 20,467.9 22,015.3 7.6 Bahrain 180.5 182.2 184.8 188.7 191.1 1.3 IR Iran 3,661.3 3,572.0 3,248.0 3,741.6 3,834.2 2.5 Iraq 2,810.0 2,593.7 2,126.5 1,377.8 2,106.2 52.9 Kuwait 1 1,996.1 1,947.0 1,745.9 2,107.6 2,288.7 8.6 Oman 891.2 882.6 825.2 759.5 699.5 –7.9 Qatar 648.2 632.9 568.9 676.0 755.3 11.7 Saudi Arabia 1 8,094.5 7,888.9 7,093.1 8,410.3 8,897.0 5.8 Syrian Arab Republic 522.5 518.3 508.4 528.0 497.6 –5.8 United Arab Emirates 2,174.7 2,115.2 1,900.3 2,248.0 2,343.6 4.3 Yemen 444.2 456.9 448.9 430.4 402.0 –6.6 Africa 6,769.8 6,620.9 6,452.4 7,270.3 8,385.5 15.3 Algeria 796.0 776.6 729.9 942.4 1,311.4 39.2 Angola 752.0 740.4 894.2 875.0 988.8 13.0 Cameroon 100.7 80.0 73.9 66.6 70.0 5.2 Congo 265.0 265.0 254.6 240.0 239.2 –0.4 Egypt 695.0 639.3 628.1 618.5 594.6 –3.9 Gabon 327.4 300.8 295.0 242.5 234.5 –3.3 SP Libyan AJ 1,347.2 1,323.5 1,200.9 1,431.9 1,580.7 10.4 Nigeria 2,053.6 2,017.6 1,801.7 2,166.3 2,356.8 8.8 Tunisia 76.1 68.8 72.1 65.7 69.3 5.5 Others 356.8 409.0 502.1 621.5 940.2 51.3 Asia and Pacific 7,166.1 7,123.7 7,182.0 7,174.8 7,306.9 1.8 Australia 699.8 633.7 622.3 518.2 440.2 –15.0 Brunei 177.9 180.5 188.4 193.4 188.8 –2.4 China 3,228.3 3,297.2 3,393.1 3,407.2 3,484.9 2.3 India 645.5 641.5 661.1 663.1 682.5 2.9 Indonesia 1,272.5 1,214.2 1,125.4 1,139.6 1,094.4 –4.0 Malaysia 598.4 579.3 596.2 621.9 677.1 8.9 New Zealand 36.7 34.5 31.0 23.6 19.8 –16.2 Others 507.0 543.0 564.5 607.8 719.2 18.3 Total world 65,792.1 65,312.7 63,923.7 67,163.1 70,575.4 5.1 OPEC 27,745.0 26,873.5 24,322.5 26,884.6 29,577.7 10.0 OPEC percentage 42.2 41.1 38.0 40.0 41.9 Notes: Totals may not add up due to independent rounding. Revisions have been made throughout the time series. 1. Including share of production from Neutral Zone.
OPEC Annual Statistical Bulletin 2004 63