40 Table Oil and gas data Algeria 64 OPEC Annual Statistical Bulletin 2004 % change 2000 2001 2002 2003* 2004* 04/03 Gross production 170,179 173,106 175,197 176,026 183,878 4.5 Marketed production 83,119 78,240 80,367 82,829 82,009 –1.0 Flaring 6,800 4,080 4,180 4,272 3,624 –15.2 Reinjection 69,162 78,152 77,571 74,645 82,928 11.1 Shrinkage 11,098 12,634 13,079 14,280 15,317 7.3 Indonesia Gross production 82,167 82,800 85,991 89,358 85,073 –4.8 Marketed production 68,365 66,300 70,350 72,800 73,300 0.7 Flaring 4,807 4,800 4,892 4,175 3,821 –8.5 Reinjection 4,453 7,000 6,049 6,517 3,900 –40.2 Shrinkage 4,542 4,700 4,700 5,866 4,052 –30.9 IR Iran Gross production 122,379 114,325 121,000 131,880 149,141 13.1 Marketed production 60,147 69,145 75,000 81,500 89,663 10.0 Flaring 12,550 7,439 8,200 13,300 13,070 –1.7 Reinjection 44,132 32,441 30,000 28,426 29,298 3.1 Shrinkage 5,550 5,300 7,800 8,654 17,110 97.7 Iraq Gross production 4,350 3,950 3,550 2,430 3,660 50.6 Marketed production 3,150 2,760 2,360 1,560 2,600 66.7 Flaring 950 950 950 700 855 22.1 Reinjection – – – – – – Shrinkage 250 240 240 170 205 20.6 Kuwait Gross production 11,200 10,546 9,457 11,020 11,861 7.6 Marketed production 9,600 9,500 8,000 9,100 9,700 6.6 Flaring 500 324 457 500 510 2.0 Reinjection – – – – – – Shrinkage 1,100 722 1,000 1,420 1,651 16.3 SP Libyan AJ Natural gas production in OPEC Members, 2000–2004 (million standard cu m) Gross production 10,150 10,330 10,360 10,600 11,950 12.7 Marketed production 5,880 6,180 6,210 6,400 7,000 9.4 Flaring 1,380 1,360 1,350 1,340 1,350 0.7 Reinjection 2,540 2,450 2,450 2,500 3,150 26.0 Shrinkage 350 340 350 360 450 25.0 Nigeria Gross production 34,860 39,300 49,584 52,750 59,761 13.3 Marketed production 12,460 14,900 15,967 19,023 22,388 17.7 Flaring 17,200 19,200 22,815 23,252 24,119 3.7 Reinjection 4,000 3,500 8,680 8,529 11,277 32.2 Shrinkage Qatar 1,200 1,700 2,122 1,946 1,977 1.6 Gross production 33,100 35,400 38,100 39,950 49,100 22.9 Marketed production 24,900 27,000 29,500 31,400 37,810 20.4 Flaring – 300 300 300 490 63.3 Reinjection 4,500 3,850 3,800 3,850 5,010 30.1 Shrinkage Saudi Arabia 3,700 4,250 4,500 4,600 5,790 25.9 Gross production 57,330 60,490 64,410 67,920 76,460 12.6 Marketed production 49,810 53,690 57,320 60,060 65,680 9.4 Flaring 580 230 70 120 220 83.3 Reinjection 100 90 160 440 470 6.8 Shrinkage 6,840 6,480 6,860 7,300 10,090 38.2
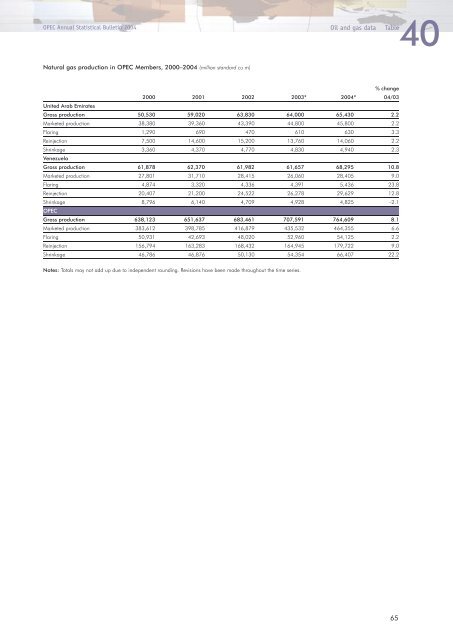
40 OPEC Annual Statistical Bulletin 2004 Oil and gas data Table Natural gas production in OPEC Members, 2000–2004 (million standard cu m) United Arab Emirates % change 2000 2001 2002 2003* 2004* 04/03 Gross production 50,530 59,020 63,830 64,000 65,430 2.2 Marketed production 38,380 39,360 43,390 44,800 45,800 2.2 Flaring 1,290 690 470 610 630 3.3 Reinjection 7,500 14,600 15,200 13,760 14,060 2.2 Shrinkage 3,360 4,370 4,770 4,830 4,940 2.3 Venezuela Gross production 61,878 62,370 61,982 61,657 68,295 10.8 Marketed production 27,801 31,710 28,415 26,060 28,405 9.0 Flaring 4,874 3,320 4,336 4,391 5,436 23.8 Reinjection 20,407 21,200 24,522 26,278 29,629 12.8 Shrinkage 8,796 6,140 4,709 4,928 4,825 –2.1 OPEC Gross production 638,123 651,637 683,461 707,591 764,609 8.1 Marketed production 383,612 398,785 416,879 435,532 464,355 6.6 Flaring 50,931 42,693 48,020 52,960 54,125 2.2 Reinjection 156,794 163,283 168,432 164,945 179,722 9.0 Shrinkage 46,786 46,876 50,130 54,354 66,407 22.2 Notes: Totals may not add up due to independent rounding. Revisions have been made throughout the time series. 65