

Download - Opec
Download - Opec
Download - Opec

You also want an ePaper? Increase the reach of your titles
YUMPU automatically turns print PDFs into web optimized ePapers that Google loves.
41<br />
Table Oil and gas data<br />
66<br />
OPEC Annual Statistical Bulletin 2004<br />
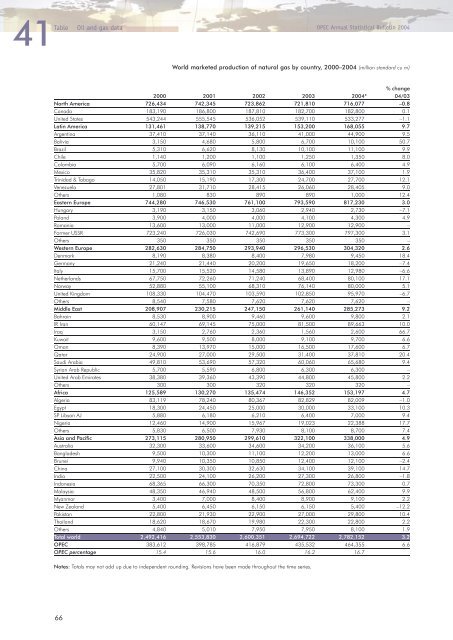
World marketed production of natural gas by country, 2000–2004 (million standard cu m)<br />
% change<br />
2000 2001 2002 2003 2004* 04/03<br />
North America 726,434 742,345 723,862 721,810 716,077 –0.8<br />
Canada 183,190 186,800 187,810 182,700 182,800 0.1<br />
United States 543,244 555,545 536,052 539,110 533,277 –1.1<br />
Latin America 131,461 138,770 139,215 153,200 168,055 9.7<br />
Argentina 37,410 37,140 36,110 41,000 44,900 9.5<br />
Bolivia 3,150 4,680 5,800 6,700 10,100 50.7<br />
Brazil 5,310 6,620 8,130 10,100 11,100 9.9<br />
Chile 1,140 1,200 1,100 1,250 1,350 8.0<br />
Colombia 5,700 6,090 6,160 6,100 6,400 4.9<br />
Mexico 35,820 35,310 35,310 36,400 37,100 1.9<br />
Trinidad & Tobago 14,050 15,190 17,300 24,700 27,700 12.1<br />
Venezuela 27,801 31,710 28,415 26,060 28,405 9.0<br />
Others 1,080 830 890 890 1,000 12.4<br />
Eastern Europe 744,280 746,530 761,100 793,590 817,230 3.0<br />
Hungary 3,190 3,150 3,060 2,940 2,730 –7.1<br />
Poland 3,900 4,000 4,000 4,100 4,300 4.9<br />
Romania 13,600 13,000 11,000 12,900 12,900 –<br />
Former USSR 723,240 726,030 742,690 773,300 797,300 3.1<br />
Others 350 350 350 350 350 –<br />
Western Europe 282,630 284,750 293,940 296,530 304,320 2.6<br />
Denmark 8,190 8,380 8,400 7,980 9,450 18.4<br />
Germany 21,240 21,440 20,200 19,650 18,200 –7.4<br />
Italy 15,700 15,520 14,580 13,890 12,980 –6.6<br />
Netherlands 67,750 72,260 71,240 68,400 80,100 17.1<br />
Norway 52,880 55,100 68,310 76,140 80,000 5.1<br />
United Kingdom 108,330 104,470 103,590 102,850 95,970 –6.7<br />
Others 8,540 7,580 7,620 7,620 7,620 –<br />
Middle East 208,907 230,215 247,150 261,140 285,273 9.2<br />
Bahrain 8,530 8,900 9,460 9,600 9,800 2.1<br />
IR Iran 60,147 69,145 75,000 81,500 89,663 10.0<br />
Iraq 3,150 2,760 2,360 1,560 2,600 66.7<br />
Kuwait 9,600 9,500 8,000 9,100 9,700 6.6<br />
Oman 8,390 13,970 15,000 16,500 17,600 6.7<br />
Qatar 24,900 27,000 29,500 31,400 37,810 20.4<br />
Saudi Arabia 49,810 53,690 57,320 60,060 65,680 9.4<br />
Syrian Arab Republic 5,700 5,590 6,800 6,300 6,300 –<br />
United Arab Emirates 38,380 39,360 43,390 44,800 45,800 2.2<br />
Others 300 300 320 320 320 –<br />
Africa 125,589 130,270 135,474 146,352 153,197 4.7<br />
Algeria 83,119 78,240 80,367 82,829 82,009 –1.0<br />
Egypt 18,300 24,450 25,000 30,000 33,100 10.3<br />
SP Libyan AJ 5,880 6,180 6,210 6,400 7,000 9.4<br />
Nigeria 12,460 14,900 15,967 19,023 22,388 17.7<br />
Others 5,830 6,500 7,930 8,100 8,700 7.4<br />
Asia and Pacific 273,115 280,950 299,610 322,100 338,000 4.9<br />
Australia 32,300 33,600 34,600 34,200 36,100 5.6<br />
Bangladesh 9,500 10,300 11,100 12,200 13,000 6.6<br />
Brunei 9,940 10,350 10,850 12,400 12,100 –2.4<br />
China 27,100 30,300 32,630 34,100 39,100 14.7<br />
India 22,500 24,100 26,200 27,300 26,800 –1.8<br />
Indonesia 68,365 66,300 70,350 72,800 73,300 0.7<br />
Malaysia 48,350 46,940 48,500 56,800 62,400 9.9<br />
Myanmar 3,400 7,000 8,400 8,900 9,100 2.2<br />
New Zealand 5,400 6,450 6,150 6,150 5,400 –12.2<br />
Pakistan 22,800 21,930 22,900 27,000 29,800 10.4<br />
Thailand 18,620 18,670 19,980 22,300 22,800 2.2<br />
Others 4,840 5,010 7,950 7,950 8,100 1.9<br />
Total world 2,492,416 2,553,830 2,600,351 2,694,722 2,782,152 3.2<br />
OPEC 383,612 398,785 416,879 435,532 464,355 6.6<br />
OPEC percentage 15.4 15.6 16.0 16.2 16.7<br />
Notes: Totals may not add up due to independent rounding. Revisions have been made throughout the time series.


