

Download - Opec
Download - Opec
Download - Opec

Create successful ePaper yourself
Turn your PDF publications into a flip-book with our unique Google optimized e-Paper software.
51<br />
Table Oil and gas data<br />
86<br />
OPEC Annual Statistical Bulletin 2004<br />
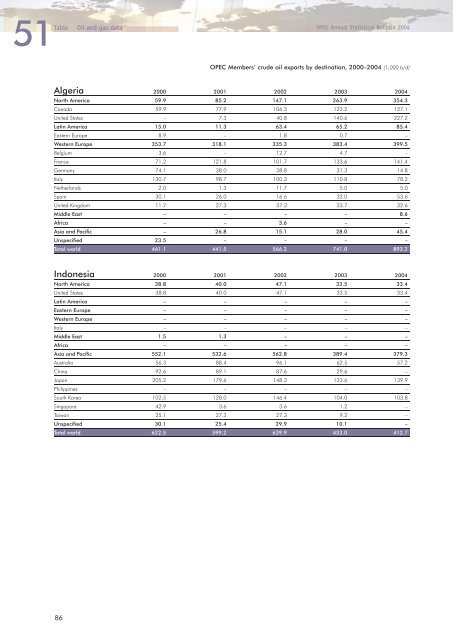
OPEC Members’ crude oil exports by destination, 2000–2004 (1,000 b/d)<br />
Algeria 2000 2001 2002 2003 2004<br />
North America 59.9 85.2 147.1 263.9 354.3<br />
Canada 59.9 77.9 106.3 123.2 127.1<br />
United States – 7.3 40.8 140.6 227.2<br />
Latin America 15.0 11.3 63.4 65.2 85.4<br />
Eastern Europe 8.9 – 1.8 0.7 –<br />
Western Europe 353.7 318.1 335.3 383.4 399.5<br />
Belgium 3.6 – 12.7 4.7 –<br />
France 71.2 121.8 101.7 133.6 141.4<br />
Germany 74.1 38.0 38.8 31.3 14.8<br />
Italy 130.7 98.7 100.3 110.8 78.2<br />
Netherlands 2.0 1.3 11.7 5.0 5.0<br />
Spain 30.1 26.0 16.6 32.0 53.6<br />
United Kingdom 11.7 27.3 37.3 33.7 32.6<br />
Middle East – – – – 8.6<br />
Africa – – 3.6 – –<br />
Asia and Pacific – 26.8 15.1 28.0 45.4<br />
Unspecified 23.5 – – – –<br />
Total world 461.1 441.5 566.2 741.0 893.2<br />
Indonesia 2000 2001 2002 2003 2004<br />
North America 38.8 40.0 47.1 33.5 33.4<br />
United States 38.8 40.0 47.1 33.5 33.4<br />
Latin America – – – – –<br />
Eastern Europe – – – – –<br />
Western Europe – – – – –<br />
Italy – – – – –<br />
Middle East 1.5 1.3 – – –<br />
Africa – – – – –<br />
Asia and Pacific 552.1 532.6 562.8 389.4 379.3<br />
Australia 56.3 88.4 96.1 62.5 57.2<br />
China 92.6 89.1 87.6 29.6 –<br />
Japan 205.2 179.6 148.3 123.6 139.9<br />
Philippines – – – – –<br />
South Korea 102.5 128.0 146.4 104.0 103.8<br />
Singapore 42.9 3.6 3.6 1.2 –<br />
Taiwan 25.1 27.3 27.3 9.2 –<br />
Unspecified 30.1 25.4 29.9 10.1 –<br />
Total world 622.5 599.2 639.9 433.0 412.7


