

Download - Opec
Download - Opec
Download - Opec

You also want an ePaper? Increase the reach of your titles
YUMPU automatically turns print PDFs into web optimized ePapers that Google loves.
28<br />
Table Summary OPEC Annual Statistical Bulletin 2004<br />
36<br />
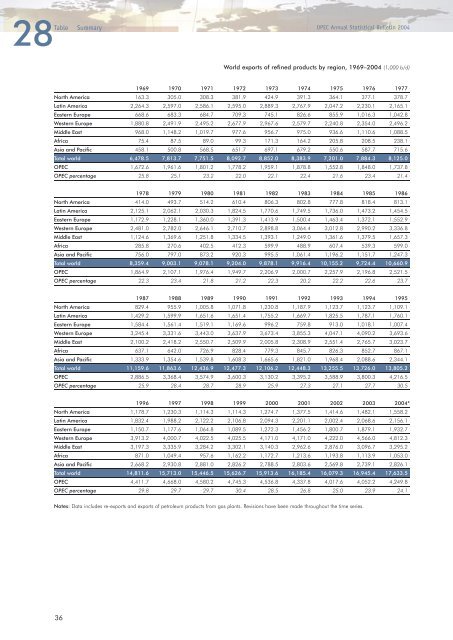
World exports of refined products by region, 1969–2004 (1,000 b/d)<br />
1969 1970 1971 1972 1973 1974 1975 1976 1977<br />
North America 163.3 305.0 308.3 381.9 424.9 391.3 364.1 377.1 378.7<br />
Latin America 2,264.3 2,597.0 2,586.1 2,595.0 2,889.3 2,767.9 2,047.2 2,230.1 2,165.1<br />
Eastern Europe 668.6 683.3 684.7 709.3 745.1 826.6 855.9 1,016.3 1,042.8<br />
Western Europe 1,880.8 2,491.9 2,495.2 2,677.9 2,967.6 2,579.7 2,240.8 2,354.0 2,496.2<br />
Middle East 968.0 1,148.2 1,019.7 977.6 956.7 975.0 936.6 1,110.6 1,088.5<br />
Africa 75.4 87.5 89.0 99.3 171.3 164.2 205.8 208.5 238.1<br />
Asia and Pacific 458.1 500.8 568.5 651.7 697.1 679.2 550.6 587.7 715.6<br />
Total world 6,478.5 7,813.7 7,751.5 8,092.7 8,852.0 8,383.9 7,201.0 7,884.3 8,125.0<br />
OPEC 1,672.6 1,961.6 1,801.2 1,778.2 1,959.1 1,878.8 1,552.8 1,848.0 1,737.8<br />
OPEC percentage 25.8 25.1 23.2 22.0 22.1 22.4 21.6 23.4 21.4<br />
1978 1979 1980 1981 1982 1983 1984 1985 1986<br />
North America 414.0 493.7 514.2 610.4 806.3 802.8 777.8 818.4 813.1<br />
Latin America 2,125.1 2,062.1 2,030.3 1,824.5 1,770.6 1,749.5 1,736.0 1,473.2 1,454.5<br />
Eastern Europe 1,172.9 1,228.1 1,360.0 1,391.3 1,413.9 1,500.4 1,463.4 1,372.1 1,552.9<br />
Western Europe 2,481.0 2,782.0 2,646.1 2,710.7 2,898.8 3,064.4 3,012.8 2,990.2 3,336.8<br />
Middle East 1,124.6 1,369.6 1,251.8 1,334.5 1,393.1 1,249.0 1,361.6 1,379.5 1,657.3<br />
Africa 285.8 270.6 402.5 412.3 599.9 488.9 607.4 539.3 599.0<br />
Asia and Pacific 756.0 797.0 873.2 920.3 995.5 1,061.4 1,196.2 1,151.7 1,247.3<br />
Total world 8,359.4 9,003.1 9,078.1 9,204.0 9,878.1 9,916.4 10,155.2 9,724.4 10,660.9<br />
OPEC 1,864.9 2,107.1 1,976.4 1,949.7 2,206.9 2,000.7 2,257.9 2,196.8 2,521.5<br />
OPEC percentage 22.3 23.4 21.8 21.2 22.3 20.2 22.2 22.6 23.7<br />
1987 1988 1989 1990 1991 1992 1993 1994 1995<br />
North America 829.4 955.9 1,005.8 1,071.8 1,230.8 1,187.9 1,123.7 1,123.7 1,109.1<br />
Latin America 1,429.2 1,599.9 1,651.6 1,651.4 1,755.2 1,669.7 1,825.5 1,787.1 1,760.1<br />
Eastern Europe 1,584.4 1,561.4 1,519.1 1,169.6 996.2 759.8 913.0 1,018.1 1,007.4<br />
Western Europe 3,245.4 3,331.6 3,443.0 3,637.9 3,673.4 3,855.3 4,047.1 4,090.2 3,693.6<br />
Middle East 2,100.2 2,418.2 2,550.7 2,509.9 2,005.8 2,308.9 2,551.4 2,765.7 3,023.7<br />
Africa 637.1 642.0 726.9 828.4 779.3 845.7 826.3 852.7 867.1<br />
Asia and Pacific 1,333.9 1,354.6 1,539.8 1,608.3 1,665.6 1,821.0 1,968.4 2,088.6 2,344.1<br />
Total world 11,159.6 11,863.6 12,436.9 12,477.3 12,106.2 12,448.3 13,255.5 13,726.0 13,805.2<br />
OPEC 2,886.5 3,368.4 3,574.9 3,600.3 3,130.2 3,395.2 3,588.9 3,800.3 4,216.5<br />
OPEC percentage 25.9 28.4 28.7 28.9 25.9 27.3 27.1 27.7 30.5<br />
1996 1997 1998 1999 2000 2001 2002 2003 2004*<br />
North America 1,178.7 1,230.3 1,114.3 1,114.3 1,274.7 1,377.5 1,414.6 1,482.1 1,558.2<br />
Latin America 1,832.4 1,988.2 2,122.2 2,106.8 2,094.3 2,201.1 2,002.4 2,068.6 2,156.1<br />
Eastern Europe 1,150.7 1,177.6 1,064.8 1,089.5 1,272.3 1,456.2 1,800.7 1,879.1 1,932.7<br />
Western Europe 3,913.2 4,000.7 4,022.5 4,025.5 4,171.0 4,171.0 4,222.0 4,566.0 4,812.3<br />
Middle East 3,197.3 3,335.9 3,284.2 3,302.1 3,140.3 2,962.6 2,876.0 3,096.7 3,295.2<br />
Africa 871.0 1,049.4 957.6 1,162.2 1,172.7 1,213.6 1,193.8 1,113.9 1,053.0<br />
Asia and Pacific 2,668.2 2,930.8 2,881.0 2,826.2 2,788.5 2,803.6 2,569.8 2,739.1 2,826.1<br />
Total world 14,811.6 15,713.0 15,446.5 15,626.7 15,913.6 16,185.4 16,079.3 16,945.4 17,633.5<br />
OPEC 4,411.7 4,668.0 4,580.2 4,745.3 4,536.8 4,337.8 4,017.6 4,052.2 4,249.8<br />
OPEC percentage 29.8 29.7 29.7 30.4 28.5 26.8 25.0 23.9 24.1<br />
Notes: Data includes re-exports and exports of petroleum products from gas plants. Revisions have been made throughout the time series.


