

Download - Opec
Download - Opec
Download - Opec

You also want an ePaper? Increase the reach of your titles
YUMPU automatically turns print PDFs into web optimized ePapers that Google loves.
66<br />
Table Transportation OPEC Annual Statistical Bulletin 2004<br />
108<br />
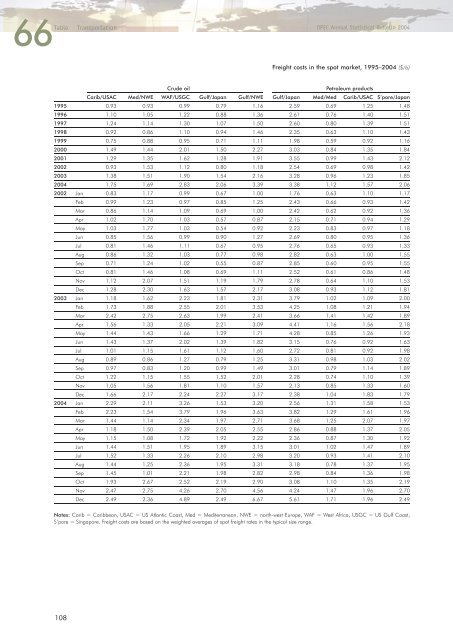
Freight costs in the spot market, 1995–2004 ($/b)<br />
Crude oil Petroleum products<br />
Carib/USAC Med/NWE WAF/USGC Gulf/Japan Gulf/NWE Gulf/Japan Med/Med Carib/USAC S’pore/Japan<br />
1995 0.93 0.93 0.99 0.79 1.16 2.59 0.69 1.25 1.48<br />
1996 1.10 1.05 1.22 0.88 1.36 2.61 0.76 1.40 1.51<br />
1997 1.24 1.14 1.30 1.07 1.50 2.60 0.80 1.39 1.51<br />
1998 0.92 0.86 1.10 0.94 1.46 2.35 0.63 1.10 1.43<br />
1999 0.75 0.88 0.95 0.71 1.11 1.98 0.59 0.92 1.16<br />
2000 1.49 1.44 2.01 1.50 2.27 3.03 0.84 1.35 1.84<br />
2001 1.29 1.35 1.62 1.28 1.91 3.55 0.99 1.43 2.12<br />
2002 0.93 1.53 1.12 0.80 1.18 2.54 0.69 0.98 1.42<br />
2003 1.38 1.51 1.90 1.54 2.16 3.28 0.96 1.23 1.85<br />
2004 1.75 1.69 2.83 2.06 3.39 3.38 1.12 1.57 2.06<br />
2002 Jan 0.83 1.17 0.99 0.67 1.00 1.76 0.63 1.10 1.17<br />
Feb 0.99 1.23 0.97 0.85 1.25 2.43 0.66 0.93 1.42<br />
Mar 0.86 1.14 1.09 0.69 1.00 2.42 0.62 0.92 1.36<br />
Apr 1.02 1.70 1.03 0.57 0.87 2.15 0.71 0.94 1.29<br />
May 1.03 1.77 1.03 0.54 0.92 2.23 0.83 0.97 1.18<br />
Jun 0.85 1.56 0.99 0.90 1.27 2.69 0.80 0.95 1.36<br />
Jul 0.81 1.46 1.11 0.67 0.95 2.76 0.65 0.93 1.33<br />
Aug 0.86 1.32 1.03 0.77 0.98 2.82 0.63 1.00 1.55<br />
Sep 0.71 1.24 1.02 0.55 0.87 2.85 0.60 0.95 1.55<br />
Oct 0.81 1.46 1.08 0.69 1.11 2.52 0.61 0.86 1.48<br />
Nov 1.12 2.07 1.51 1.19 1.79 2.78 0.64 1.10 1.53<br />
Dec 1.28 2.30 1.63 1.57 2.17 3.08 0.93 1.12 1.81<br />
2003 Jan 1.18 1.62 2.23 1.81 2.31 3.79 1.02 1.09 2.00<br />
Feb 1.73 1.88 2.55 2.01 3.53 4.25 1.08 1.21 1.94<br />
Mar 2.42 2.75 2.63 1.99 2.41 3.66 1.41 1.42 1.89<br />
Apr 1.56 1.33 2.05 2.21 3.09 4.41 1.16 1.56 2.18<br />
May 1.44 1.43 1.66 1.29 1.71 4.28 0.85 1.26 1.93<br />
Jun 1.43 1.37 2.02 1.39 1.82 3.15 0.76 0.92 1.63<br />
Jul 1.01 1.15 1.61 1.12 1.60 2.72 0.81 0.92 1.98<br />
Aug 0.89 0.86 1.27 0.79 1.25 3.31 0.98 1.03 2.02<br />
Sep 0.97 0.83 1.20 0.99 1.49 3.01 0.79 1.14 1.89<br />
Oct 1.22 1.15 1.55 1.52 2.01 2.28 0.74 1.10 1.39<br />
Nov 1.05 1.56 1.81 1.10 1.57 2.13 0.85 1.33 1.60<br />
Dec 1.66 2.17 2.24 2.27 3.17 2.38 1.04 1.83 1.79<br />
2004 Jan 2.29 2.11 3.26 1.53 3.20 2.56 1.31 1.58 1.53<br />
Feb 2.23 1.54 3.79 1.96 3.63 3.82 1.29 1.61 1.96<br />
Mar 1.44 1.14 2.34 1.97 2.71 3.68 1.25 2.07 1.97<br />
Apr 1.18 1.50 2.39 2.05 2.55 2.86 0.88 1.37 2.05<br />
May 1.15 1.08 1.72 1.92 2.22 2.36 0.87 1.30 1.92<br />
Jun 1.44 1.51 1.95 1.89 3.15 3.01 1.02 1.47 1.89<br />
Jul 1.52 1.33 2.26 2.10 2.98 3.20 0.93 1.41 2.10<br />
Aug 1.44 1.25 2.36 1.95 3.31 3.18 0.78 1.37 1.95<br />
Sep 1.45 1.01 2.21 1.98 2.82 2.98 0.84 1.36 1.98<br />
Oct 1.93 2.67 2.52 2.19 2.90 3.08 1.10 1.35 2.19<br />
Nov 2.47 2.75 4.26 2.70 4.56 4.24 1.47 1.96 2.70<br />
Dec 2.49 2.36 4.89 2.49 6.67 5.61 1.71 1.96 2.49<br />
Notes: Carib = Caribbean, USAC = US Atlantic Coast, Med = Mediterranean, NWE = north-west Europe, WAF = West Africa, USGC = US Gulf Coast,<br />
S’pore = Singapore. Freight costs are based on the weighted averages of spot freight rates in the typical size range.


