Download - Opec
Download - Opec
Download - Opec
You also want an ePaper? Increase the reach of your titles
YUMPU automatically turns print PDFs into web optimized ePapers that Google loves.
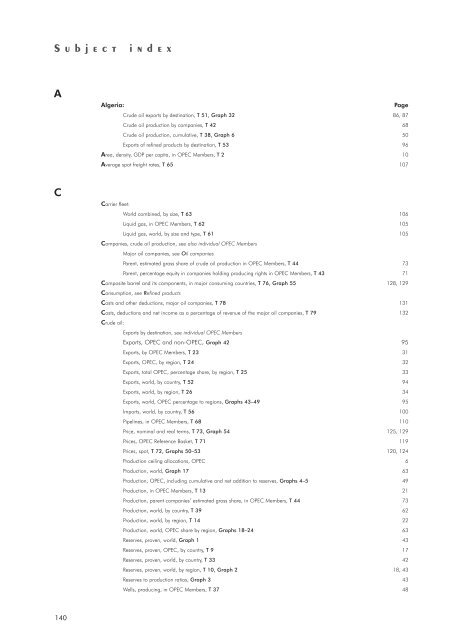
S u b j e c t i n d e x<br />
A<br />
C<br />
140<br />
Algeria: Page<br />
Crude oil exports by destination, T 51, Graph 32 86, 87<br />
Crude oil production by companies, T 42 68<br />
Crude oil production, cumulative, T 38, Graph 6 50<br />
Exports of refined products by destination, T 53 96<br />
Area, density, GDP per capita, in OPEC Members, T 2 10<br />
Average spot freight rates, T 65 107<br />
Carrier fleet:<br />
World combined, by size, T 63 106<br />
Liquid gas, in OPEC Members, T 62 105<br />
Liquid gas, world, by size and type, T 61 105<br />
Companies, crude oil production, see also individual OPEC Members<br />
Major oil companies, see Oil companies<br />
Parent, estimated gross share of crude oil production in OPEC Members, T 44 73<br />
Parent, percentage equity in companies holding producing rights in OPEC Members, T 43 71<br />
Composite barrel and its components, in major consuming countries, T 76, Graph 55 128, 129<br />
Consumption, see Refined products<br />
Costs and other deductions, major oil companies, T 78 131<br />
Costs, deductions and net income as a percentage of revenue of the major oil companies, T 79 132<br />
Crude oil:<br />
Exports by destination, see individual OPEC Members<br />
Exports, OPEC and non-OPEC, Graph 42 95<br />
Exports, by OPEC Members, T 23 31<br />
Exports, OPEC, by region, T 24 32<br />
Exports, total OPEC, percentage share, by region, T 25 33<br />
Exports, world, by country, T 52 94<br />
Exports, world, by region, T 26 34<br />
Exports, world, OPEC percentage to regions, Graphs 43–49 95<br />
Imports, world, by country, T 56 100<br />
Pipelines, in OPEC Members, T 68 110<br />
Price, nominal and real terms, T 73, Graph 54 125, 129<br />
Prices, OPEC Reference Basket, T 71 119<br />
Prices, spot, T 72, Graphs 50–53 120, 124<br />
Production ceiling allocations, OPEC 6<br />
Production, world, Graph 17 63<br />
Production, OPEC, including cumulative and net addition to reserves, Graphs 4–5 49<br />
Production, in OPEC Members, T 13 21<br />
Production, parent companies’ estimated gross share, in OPEC Members, T 44 73<br />
Production, world, by country, T 39 62<br />
Production, world, by region, T 14 22<br />
Production, world, OPEC share by region, Graphs 18–24 63<br />
Reserves, proven, world, Graph 1 43<br />
Reserves, proven, OPEC, by country, T 9 17<br />
Reserves, proven, world, by country, T 33 42<br />
Reserves, proven, world, by region, T 10, Graph 2 18, 43<br />
Reserves to production ratios, Graph 3 43<br />
Wells, producing, in OPEC Members, T 37 48


