

Download - Opec
Download - Opec
Download - Opec

You also want an ePaper? Increase the reach of your titles
YUMPU automatically turns print PDFs into web optimized ePapers that Google loves.
78<br />
OPEC Annual Statistical Bulletin 2004 Major oil companies Table<br />
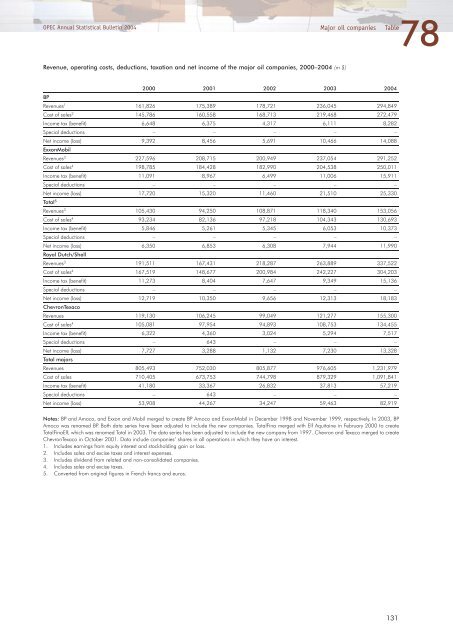
Revenue, operating costs, deductions, taxation and net income of the major oil companies, 2000–2004 (m $)<br />
BP<br />
2000 2001 2002 2003 2004<br />
Revenues 1 161,826 175,389 178,721 236,045 294,849<br />
Cost of sales 2 145,786 160,558 168,713 219,468 272,479<br />
Income tax (benefit) 6,648 6,375 4,317 6,111 8,282<br />
Special deductions – – – – –<br />
Net income (loss) 9,392 8,456 5,691 10,466 14,088<br />
ExxonMobil<br />
Revenues 3 227,596 208,715 200,949 237,054 291,252<br />
Cost of sales 4 198,785 184,428 182,990 204,538 250,011<br />
Income tax (benefit) 11,091 8,967 6,499 11,006 15,911<br />
Special deductions – – – – –<br />
Net income (loss) 17,720 15,320 11,460 21,510 25,330<br />
Total 5<br />
Revenues 3 105,430 94,250 108,871 118,340 153,056<br />
Cost of sales 4 93,234 82,136 97,218 104,343 130,693<br />
Income tax (benefit) 5,846 5,261 5,345 6,053 10,373<br />
Special deductions – – – – –<br />
Net income (loss) 6,350 6,853 6,308 7,944 11,990<br />
Royal Dutch/Shell<br />
Revenues 3 191,511 167,431 218,287 263,889 337,522<br />
Cost of sales 4 167,519 148,677 200,984 242,227 304,203<br />
Income tax (benefit) 11,273 8,404 7,647 9,349 15,136<br />
Special deductions – – – – –<br />
Net income (loss) 12,719 10,350 9,656 12,313 18,183<br />
ChevronTexaco<br />
Revenues 119,130 106,245 99,049 121,277 155,300<br />
Cost of sales 4 105,081 97,954 94,893 108,753 134,455<br />
Income tax (benefit) 6,322 4,360 3,024 5,294 7,517<br />
Special deductions – 643 – – –<br />
Net income (loss) 7,727 3,288 1,132 7,230 13,328<br />
Total majors<br />
Revenues 805,493 752,030 805,877 976,605 1,231,979<br />
Cost of sales 710,405 673,753 744,798 879,329 1,091,841<br />
Income tax (benefit) 41,180 33,367 26,832 37,813 57,219<br />
Special deductions – 643 – – –<br />
Net income (loss) 53,908 44,267 34,247 59,463 82,919<br />
Notes: BP and Amoco, and Exxon and Mobil merged to create BP Amoco and ExxonMobil in December 1998 and November 1999, respectively. In 2003, BP<br />
Amoco was renamed BP. Both data series have been adjusted to include the new companies. TotalFina merged with Elf Aquitaine in February 2000 to create<br />
TotalFinaElf, which was renamed Total in 2003. The data series has been adjusted to include the new company from 1997. Chevron and Texaco merged to create<br />
ChevronTexaco in October 2001. Data include companies’ shares in all operations in which they have an interest.<br />
1. Includes earnings from equity interest and stockholding gain or loss.<br />
2. Includes sales and excise taxes and interest expenses.<br />
3. Includes dividend from related and non-consolidated companies.<br />
4. Includes sales and excise taxes.<br />
5. Converted from original figures in French francs and euros.<br />
131


