37 Table Oil and gas data 48 OPEC Annual Statistical Bulletin 2004 Producing wells in OPEC Members, 2000–2004 % change 2000 2001 2002 2003 2004* 04/03 Algeria 1,235 1,284 1,295 1,400 1,446 3.3 Flowing 930 967 973 1,052 1,094 4.0 Artificial lift 305 317 322 348 352 1.1 Indonesia 9,341 9,150 9,075 8,275 8,763 5.9 Flowing 1,511 1,465 1,395 1,272 1,569 23.3 Artificial lift 7,830 7,685 7,680 7,003 7,194 2.7 IR Iran 1,287 1,416 1,331 1,415 1,468 3.7 Flowing 1,287 1,416 1,331 1,415 1,468 3.7 Artificial lift – – – – – – Iraq na na na na na na Flowing na na na na na na Artificial lift na na na na na na Kuwait 785 805 800 950 980 3.2 Flowing 785 805 800 950 980 3.2 Artificial lift – – – – – – SP Libyan AJ 1,436 1,545 1,498 1,535 1,570 2.3 Flowing 904 1,004 938 965 991 2.7 Artificial lift 532 541 560 570 580 1.8 Nigeria 2,109 2,430 2,463 2,650 2,769 4.5 Flowing 1,779 2,030 1,883 2,060 2,110 2.4 Artificial lift 330 400 580 590 659 11.7 Qatar 415 442 468 564 568 0.7 Flowing 325 307 309 337 324 –3.9 Artificial lift 90 135 159 227 244 7.5 Saudi Arabia 1,550 1,575 1,525 1,780 1,757 –1.3 Flowing 1,457 1,480 1,430 1,670 1,641 –1.7 Artificial lift 93 95 95 110 116 5.5 Saudi–Kuwaiti Neutral Zone 550 615 600 650 702 8.0 Flowing 210 218 213 230 237 3.0 Artificial lift 340 397 387 420 465 10.7 United Arab Emirates 1,505 1,410 1,417 1,546 1,507 –2.5 Flowing 1,143 1,063 1,068 1,159 1,130 –2.5 Artificial lift 362 347 349 387 377 –2.6 Venezuela 15,506 14,987 12,982 11,550 12,050 4.3 Flowing 1,223 665 570 515 285 –44.6 Artificial lift 14,283 14,322 12,412 11,035 11,765 6.6 OPEC 2 35,719 35,659 33,454 32,315 33,580 3.9 Flowing 11,554 11,420 10,910 11,625 11,829 1.8 Artificial lift 24,165 24,239 22,544 20,690 21,752 5.1 Total world 1,2 759,620 758,140 764,438 755,683 753,611 –0.3 Flowing 46,696 44,158 45,395 48,775 46,582 –4.5 Artificial lift 712,924 713,062 718,148 705,950 707,030 0.2 Notes: Excluding shut-in wells. Figures as at year-end. 1. Excluding Eastern Europe. 2. Summation of wells by category may not equal the total for OPEC due to lack of data for some countries.
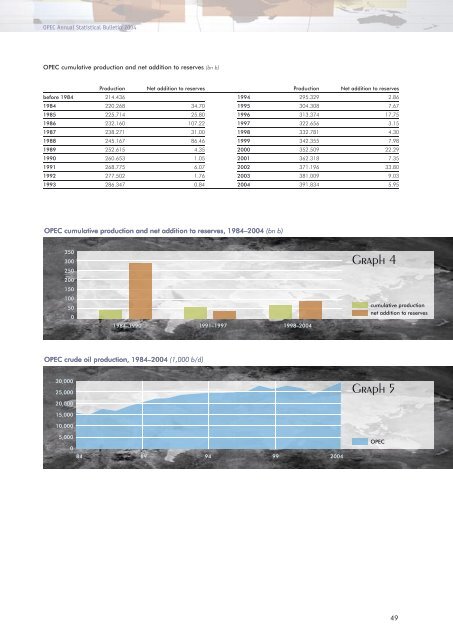
OPEC Annual Statistical Bulletin 2004 OPEC cumulative production and net addition to reserves (bn b) before 1984 214.436 Production Net addition to reserves 1984 220.268 34.70 1985 225.714 25.80 1986 232.160 107.22 1987 238.271 31.00 1988 245.167 86.46 1989 252.615 4.35 1990 260.653 1.05 1991 268.775 6.07 1992 277.502 1.76 1993 286.347 0.84 Production Net addition to reserves 1994 295.329 2.86 1995 304.308 7.67 1996 313.374 17.75 1997 322.656 3.15 1998 332.781 4.30 1999 342.355 7.98 2000 352.509 22.29 2001 362.318 7.35 2002 371.196 33.80 2003 381.009 9.03 2004 391.834 5.95 49