

Download - Opec
Download - Opec
Download - Opec

You also want an ePaper? Increase the reach of your titles
YUMPU automatically turns print PDFs into web optimized ePapers that Google loves.
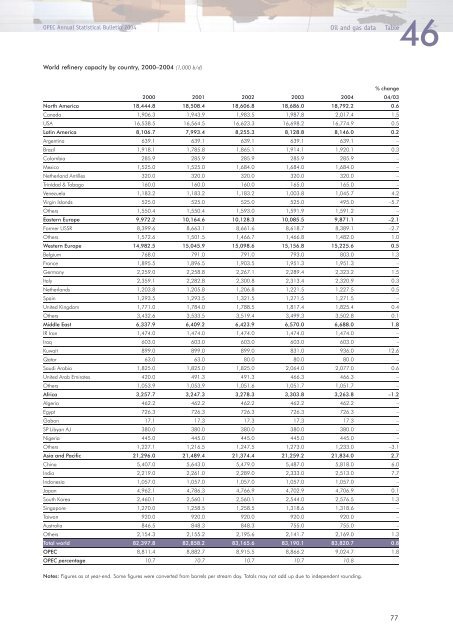
46<br />
OPEC Annual Statistical Bulletin 2004 Oil and gas data Table<br />
World refinery capacity by country, 2000–2004 (1,000 b/d)<br />
% change<br />
2000 2001 2002 2003 2004 04/03<br />
North America 18,444.8 18,508.4 18,606.8 18,686.0 18,792.2 0.6<br />
Canada 1,906.3 1,943.9 1,983.5 1,987.8 2,017.4 1.5<br />
USA 16,538.5 16,564.5 16,623.3 16,698.2 16,774.9 0.5<br />
Latin America 8,106.7 7,993.4 8,255.3 8,128.8 8,146.0 0.2<br />
Argentina 639.1 639.1 639.1 639.1 639.1 –<br />
Brazil 1,918.1 1,785.8 1,865.1 1,914.1 1,920.1 0.3<br />
Colombia 285.9 285.9 285.9 285.9 285.9 –<br />
Mexico 1,525.0 1,525.0 1,684.0 1,684.0 1,684.0 –<br />
Netherland Antilles 320.0 320.0 320.0 320.0 320.0 –<br />
Trinidad & Tobago 160.0 160.0 160.0 165.0 165.0 –<br />
Venezuela 1,183.2 1,183.2 1,183.2 1,003.8 1,045.7 4.2<br />
Virgin Islands 525.0 525.0 525.0 525.0 495.0 –5.7<br />
Others 1,550.4 1,550.4 1,593.0 1,591.9 1,591.2 –<br />
Eastern Europe 9,972.2 10,164.6 10,128.3 10,085.5 9,871.1 –2.1<br />
Former USSR 8,399.6 8,663.1 8,661.6 8,618.7 8,389.1 –2.7<br />
Others 1,572.6 1,501.5 1,466.7 1,466.8 1,482.0 1.0<br />
Western Europe 14,982.5 15,045.9 15,098.6 15,156.8 15,225.6 0.5<br />
Belgium 768.0 791.0 791.0 793.0 803.0 1.3<br />
France 1,895.5 1,896.5 1,903.5 1,951.3 1,951.3 –<br />
Germany 2,259.0 2,258.8 2,267.1 2,289.4 2,323.2 1.5<br />
Italy 2,359.1 2,282.8 2,300.8 2,313.4 2,320.9 0.3<br />
Netherlands 1,203.8 1,205.8 1,206.8 1,221.5 1,227.5 0.5<br />
Spain 1,293.5 1,293.5 1,321.5 1,271.5 1,271.5 –<br />
United Kingdom 1,771.0 1,784.0 1,788.5 1,817.4 1,825.4 0.4<br />
Others 3,432.6 3,533.5 3,519.4 3,499.3 3,502.8 0.1<br />
Middle East 6,337.9 6,409.2 6,423.9 6,570.0 6,688.0 1.8<br />
IR Iran 1,474.0 1,474.0 1,474.0 1,474.0 1,474.0 –<br />
Iraq 603.0 603.0 603.0 603.0 603.0 –<br />
Kuwait 899.0 899.0 899.0 831.0 936.0 12.6<br />
Qatar 63.0 63.0 80.0 80.0 80.0 –<br />
Saudi Arabia 1,825.0 1,825.0 1,825.0 2,064.0 2,077.0 0.6<br />
United Arab Emirates 420.0 491.3 491.3 466.3 466.3 –<br />
Others 1,053.9 1,053.9 1,051.6 1,051.7 1,051.7 –<br />
Africa 3,257.7 3,247.3 3,278.3 3,303.8 3,263.8 –1.2<br />
Algeria 462.2 462.2 462.2 462.2 462.2 –<br />
Egypt 726.3 726.3 726.3 726.3 726.3 –<br />
Gabon 17.1 17.3 17.3 17.3 17.3 –<br />
SP Libyan AJ 380.0 380.0 380.0 380.0 380.0 –<br />
Nigeria 445.0 445.0 445.0 445.0 445.0 –<br />
Others 1,227.1 1,216.5 1,247.5 1,273.0 1,233.0 –3.1<br />
Asia and Pacific 21,296.0 21,489.4 21,374.4 21,259.2 21,834.0 2.7<br />
China 5,407.0 5,643.0 5,479.0 5,487.0 5,818.0 6.0<br />
India 2,219.0 2,261.0 2,289.0 2,333.0 2,513.0 7.7<br />
Indonesia 1,057.0 1,057.0 1,057.0 1,057.0 1,057.0 –<br />
Japan 4,962.1 4,786.3 4,766.9 4,702.9 4,706.9 0.1<br />
South Korea 2,460.1 2,560.1 2,560.1 2,544.0 2,576.5 1.3<br />
Singapore 1,270.0 1,258.5 1,258.5 1,318.6 1,318.6 –<br />
Taiwan 920.0 920.0 920.0 920.0 920.0 –<br />
Australia 846.5 848.3 848.3 755.0 755.0 –<br />
Others 2,154.3 2,155.2 2,195.6 2,141.7 2,169.0 1.3<br />
Total world 82,397.8 82,858.2 83,165.6 83,190.1 83,820.7 0.8<br />
OPEC 8,811.4 8,882.7 8,915.5 8,866.2 9,024.7 1.8<br />
OPEC percentage 10.7 10.7 10.7 10.7 10.8<br />
Notes: Figures as at year-end. Some figures were converted from barrels per stream day. Totals may not add up due to independent rounding.<br />
77


