58 Table Oil and gas data 102 OPEC Annual Statistical Bulletin 2004 World imports of natural gas by country, 2000–2004 (million standard cu m) % change 2000 2001 2002 2003 2004* 04/03 North America 109,208 118,324 119,070 121,180 128,990 6.4 Canada 2,060 4,730 5,350 7,820 8,700 11.3 United States 107,148 113,594 113,720 113,360 120,290 6.1 Latin America 9,560 14,220 18,700 21,480 27,520 28.1 Argentina – – – – 800 – Brazil 2,120 4,420 5,260 5,320 7,600 42.9 Chile 4,070 5,140 5,340 6,060 7,200 18.8 Dominican Republic – – – 300 180 –40.0 Mexico 2,980 3,990 7,450 9,000 11,000 22.2 Puerto Rico 350 630 630 740 680 –8.1 Uruguay 40 40 20 60 60 – Eastern Europe 40,850 40,800 42,250 44,730 50,000 11.8 Bulgaria 3,200 2,900 2,800 2,800 2,900 3.6 Former Czechoslovakia 17,300 17,600 17,630 17,220 17,100 –0.7 Hungary 9,200 9,300 10,290 10,300 11,000 6.8 Latvia – – – – 1,400 – Lithuania – – – – 2,600 – Poland 7,750 8,000 7,830 8,710 9,100 4.5 Romania 3,400 3,000 3,700 5,700 5,900 3.5 Western Europe 265,470 265,324 285,125 309,614 329,010 6.3 Austria 6,120 6,550 6,730 7,800 7,800 – Belgium 16,300 16,039 16,200 17,800 19,300 8.4 Denmark – – 100 200 200 – Finland 4,300 4,500 4,400 4,840 4,610 –4.8 France 42,620 41,590 43,110 41,900 44,700 6.7 Germany 76,200 78,200 83,790 85,980 91,800 6.8 Greece 2,140 1,980 2,020 2,450 2,750 12.2 Ireland 2,600 3,500 3,430 3,700 3,700 – Italy 58,500 54,750 57,725 62,100 67,200 8.2 Luxembourg 700 800 900 1,200 1,300 8.3 Netherlands 12,600 8,530 12,270 16,700 13,300 –20.4 Portugal 2,350 2,460 2,680 3,350 3,560 6.3 Spain 16,930 18,985 20,900 23,994 27,300 13.8 Sweden 840 950 1,280 1,250 1,050 –16.0 Switzerland 3,050 3,030 2,770 2,920 2,870 –1.7 Turkey 14,300 16,380 17,720 21,520 22,200 3.2 United Kingdom 2,200 3,000 5,100 7,510 11,400 51.8 Former Yugoslavia 3,720 4,080 4,000 4,400 3,970 –9.8 Middle East 2,650 4,500 4,900 6,331 7,500 18.5 IR Iran 2,650 4,500 4,900 5,731 5,200 –9.3 Jordan – – – 400 1,100 175.0 Kuwait – – – – – – United Arab Emirates – – – 200 1,200 – Africa 1,730 1,580 2,290 2,090 1,900 –9.1 Morocco – – 600 600 600 – Tunisia 1,730 1,580 1,690 1,490 1,300 –12.8 Asia and Pacific 101,080 108,716 113,150 125,870 133,900 6.4 India – – – – 2,600 – Japan 72,590 74,306 72,770 79,770 77,000 –3.5 South Korea 19,680 21,830 23,989 26,230 29,900 14.0 Malaysia – – 331 – – – Singapore 1,500 1,270 2,660 5,320 7,800 46.6 Taiwan 5,980 6,400 7,200 7,480 9,100 21.7 Thailand 1,330 4,910 6,200 7,070 7,500 6.1 Total world 530,548 553,464 585,485 631,295 678,820 7.5 OPEC 2,650 4,500 4,900 6,131 6,300 2.8 OPEC percentage 0.5 0.8 0.8 1.0 0.9
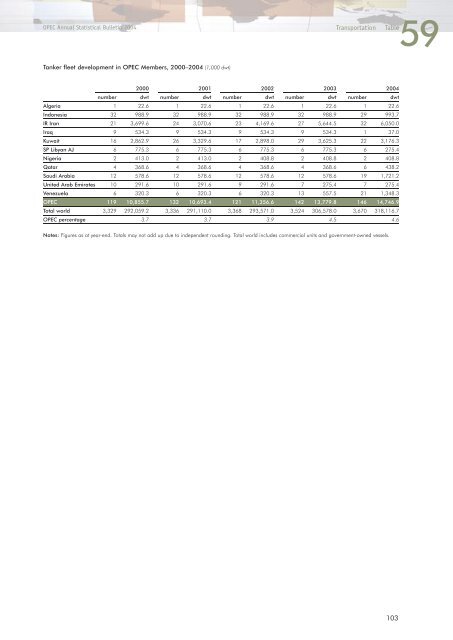
59 OPEC Annual Statistical Bulletin 2004 Transportation Table Tanker fleet development in OPEC Members, 2000–2004 (1,000 dwt) 2000 2001 2002 2003 2004 number dwt number dwt number dwt number dwt number dwt Algeria 1 22.6 1 22.6 1 22.6 1 22.6 1 22.6 Indonesia 32 988.9 32 988.9 32 988.9 32 988.9 29 993.7 IR Iran 21 3,699.6 24 3,070.6 23 4,169.6 27 5,644.5 32 6,050.0 Iraq 9 534.3 9 534.3 9 534.3 9 534.3 1 37.0 Kuwait 16 2,862.9 26 3,329.6 17 2,898.0 29 3,625.3 22 3,176.3 SP Libyan AJ 6 775.3 6 775.3 6 775.3 6 775.3 6 275.4 Nigeria 2 413.0 2 413.0 2 408.8 2 408.8 2 408.8 Qatar 4 368.6 4 368.6 4 368.6 4 368.6 6 438.2 Saudi Arabia 12 578.6 12 578.6 12 578.6 12 578.6 19 1,721.2 United Arab Emirates 10 291.6 10 291.6 9 291.6 7 275.4 7 275.4 Venezuela 6 320.3 6 320.3 6 320.3 13 557.5 21 1,348.3 OPEC 119 10,855.7 132 10,693.4 121 11,356.6 142 13,779.8 146 14,746.9 Total world 3,329 292,059.2 3,336 291,110.0 3,368 293,571.0 3,524 306,578.0 3,670 318,116.7 OPEC percentage 3.7 3.7 3.9 4.5 4.6 Notes: Figures as at year-end. Totals may not add up due to independent rounding. Total world includes commercial units and government-owned vessels. 103