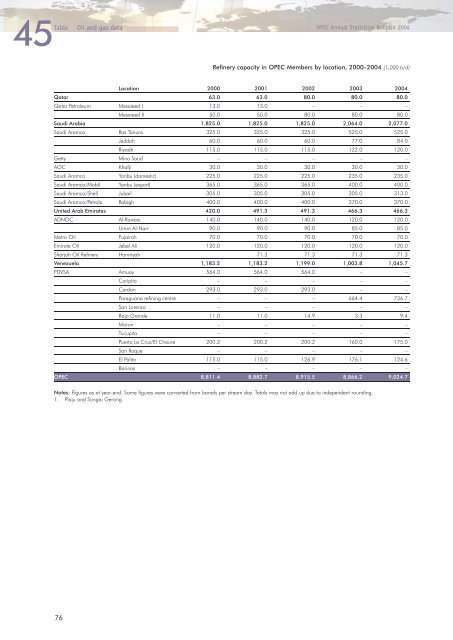
45 Table Oil and gas data 76 OPEC Annual Statistical Bulletin 2004 Refinery capacity in OPEC Members by location, 2000–2004 (1,000 b/d) Location 2000 2001 2002 2003 2004 Qatar 63.0 63.0 80.0 80.0 80.0 Qatar Petroleum Mesaieed I 13.0 13.0 – – – Mesaieed II 50.0 50.0 80.0 80.0 80.0 Saudi Arabia 1,825.0 1,825.0 1,825.0 2,064.0 2,077.0 Saudi Aramco Ras Tanura 325.0 325.0 325.0 525.0 525.0 Jeddah 60.0 60.0 60.0 77.0 84.0 Riyadh 115.0 115.0 115.0 122.0 120.0 Getty Mina Saud – – – – – AOC Khafji 30.0 30.0 30.0 30.0 30.0 Saudi Aramco Yanbu (domestic) 225.0 225.0 225.0 235.0 235.0 Saudi Aramco/Mobil Yanbu (export) 365.0 365.0 365.0 400.0 400.0 Saudi Aramco/Shell Jubail 305.0 305.0 305.0 305.0 313.0 Saudi Aramco/Petrola Rabigh 400.0 400.0 400.0 370.0 370.0 United Arab Emirates 420.0 491.3 491.3 466.3 466.3 ADNOC Al-Ruwais 140.0 140.0 140.0 120.0 120.0 Umm Al-Narr 90.0 90.0 90.0 85.0 85.0 Metro Oil Fujairah 70.0 70.0 70.0 70.0 70.0 Emirate Oil Jebel Ali 120.0 120.0 120.0 120.0 120.0 Sharjah Oil Refinery Hamriyah 71.3 71.3 71.3 71.3 Venezuela 1,183.2 1,183.2 1,199.0 1,003.8 1,045.7 PDVSA Amuay 564.0 564.0 564.0 – – Caripito – – – – – Cardon 293.0 293.0 293.0 – – Paraguana refining centre – – – 664.4 736.7 San Lorenzo – – – – – Bajo Grande 11.0 11.0 14.9 3.3 9.4 Moron – – – – – Tucupita – – – – – Puerto La Cruz/El Chaure 200.2 200.2 200.2 160.0 175.0 San Roque – – – – – El Palito 115.0 115.0 126.9 176.1 124.6 Barinas – – – – – OPEC 8,811.4 8,882.7 8,915.5 8,866.2 9,024.7 Notes: Figures as at year-end. Some figures were converted from barrels per stream day. Totals may not add up due to independent rounding. 1. Plaju and Sungai Gerong.
46 OPEC Annual Statistical Bulletin 2004 Oil and gas data Table World refinery capacity by country, 2000–2004 (1,000 b/d) % change 2000 2001 2002 2003 2004 04/03 North America 18,444.8 18,508.4 18,606.8 18,686.0 18,792.2 0.6 Canada 1,906.3 1,943.9 1,983.5 1,987.8 2,017.4 1.5 USA 16,538.5 16,564.5 16,623.3 16,698.2 16,774.9 0.5 Latin America 8,106.7 7,993.4 8,255.3 8,128.8 8,146.0 0.2 Argentina 639.1 639.1 639.1 639.1 639.1 – Brazil 1,918.1 1,785.8 1,865.1 1,914.1 1,920.1 0.3 Colombia 285.9 285.9 285.9 285.9 285.9 – Mexico 1,525.0 1,525.0 1,684.0 1,684.0 1,684.0 – Netherland Antilles 320.0 320.0 320.0 320.0 320.0 – Trinidad & Tobago 160.0 160.0 160.0 165.0 165.0 – Venezuela 1,183.2 1,183.2 1,183.2 1,003.8 1,045.7 4.2 Virgin Islands 525.0 525.0 525.0 525.0 495.0 –5.7 Others 1,550.4 1,550.4 1,593.0 1,591.9 1,591.2 – Eastern Europe 9,972.2 10,164.6 10,128.3 10,085.5 9,871.1 –2.1 Former USSR 8,399.6 8,663.1 8,661.6 8,618.7 8,389.1 –2.7 Others 1,572.6 1,501.5 1,466.7 1,466.8 1,482.0 1.0 Western Europe 14,982.5 15,045.9 15,098.6 15,156.8 15,225.6 0.5 Belgium 768.0 791.0 791.0 793.0 803.0 1.3 France 1,895.5 1,896.5 1,903.5 1,951.3 1,951.3 – Germany 2,259.0 2,258.8 2,267.1 2,289.4 2,323.2 1.5 Italy 2,359.1 2,282.8 2,300.8 2,313.4 2,320.9 0.3 Netherlands 1,203.8 1,205.8 1,206.8 1,221.5 1,227.5 0.5 Spain 1,293.5 1,293.5 1,321.5 1,271.5 1,271.5 – United Kingdom 1,771.0 1,784.0 1,788.5 1,817.4 1,825.4 0.4 Others 3,432.6 3,533.5 3,519.4 3,499.3 3,502.8 0.1 Middle East 6,337.9 6,409.2 6,423.9 6,570.0 6,688.0 1.8 IR Iran 1,474.0 1,474.0 1,474.0 1,474.0 1,474.0 – Iraq 603.0 603.0 603.0 603.0 603.0 – Kuwait 899.0 899.0 899.0 831.0 936.0 12.6 Qatar 63.0 63.0 80.0 80.0 80.0 – Saudi Arabia 1,825.0 1,825.0 1,825.0 2,064.0 2,077.0 0.6 United Arab Emirates 420.0 491.3 491.3 466.3 466.3 – Others 1,053.9 1,053.9 1,051.6 1,051.7 1,051.7 – Africa 3,257.7 3,247.3 3,278.3 3,303.8 3,263.8 –1.2 Algeria 462.2 462.2 462.2 462.2 462.2 – Egypt 726.3 726.3 726.3 726.3 726.3 – Gabon 17.1 17.3 17.3 17.3 17.3 – SP Libyan AJ 380.0 380.0 380.0 380.0 380.0 – Nigeria 445.0 445.0 445.0 445.0 445.0 – Others 1,227.1 1,216.5 1,247.5 1,273.0 1,233.0 –3.1 Asia and Pacific 21,296.0 21,489.4 21,374.4 21,259.2 21,834.0 2.7 China 5,407.0 5,643.0 5,479.0 5,487.0 5,818.0 6.0 India 2,219.0 2,261.0 2,289.0 2,333.0 2,513.0 7.7 Indonesia 1,057.0 1,057.0 1,057.0 1,057.0 1,057.0 – Japan 4,962.1 4,786.3 4,766.9 4,702.9 4,706.9 0.1 South Korea 2,460.1 2,560.1 2,560.1 2,544.0 2,576.5 1.3 Singapore 1,270.0 1,258.5 1,258.5 1,318.6 1,318.6 – Taiwan 920.0 920.0 920.0 920.0 920.0 – Australia 846.5 848.3 848.3 755.0 755.0 – Others 2,154.3 2,155.2 2,195.6 2,141.7 2,169.0 1.3 Total world 82,397.8 82,858.2 83,165.6 83,190.1 83,820.7 0.8 OPEC 8,811.4 8,882.7 8,915.5 8,866.2 9,024.7 1.8 OPEC percentage 10.7 10.7 10.7 10.7 10.8 Notes: Figures as at year-end. Some figures were converted from barrels per stream day. Totals may not add up due to independent rounding. 77