

Download - Opec
Download - Opec
Download - Opec

You also want an ePaper? Increase the reach of your titles
YUMPU automatically turns print PDFs into web optimized ePapers that Google loves.
20<br />
Table Summary OPEC Annual Statistical Bulletin 2004<br />
28<br />
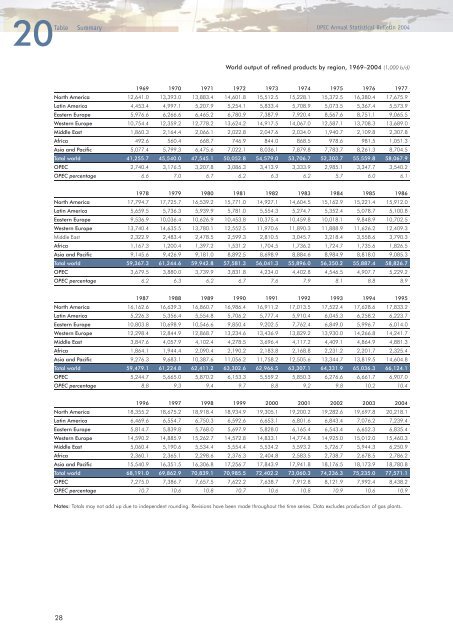
World output of refined products by region, 1969–2004 (1,000 b/d)<br />
1969 1970 1971 1972 1973 1974 1975 1976 1977<br />
North America 12,641.0 13,393.0 13,883.4 14,601.8 15,512.5 15,228.1 15,372.5 16,380.4 17,675.9<br />
Latin America 4,453.4 4,997.1 5,207.9 5,254.1 5,833.4 5,708.9 5,073.5 5,367.4 5,573.9<br />
Eastern Europe 5,976.6 6,266.6 6,465.2 6,780.9 7,387.9 7,920.4 8,567.6 8,751.1 9,065.5<br />
Western Europe 10,754.4 12,359.2 12,778.2 13,624.2 14,917.5 14,067.0 12,587.1 13,708.3 13,689.0<br />
Middle East 1,860.3 2,164.4 2,066.1 2,022.8 2,047.6 2,034.0 1,940.7 2,109.8 2,307.8<br />
Africa 492.6 560.4 668.7 746.9 844.0 868.5 978.6 981.5 1,051.3<br />
Asia and Pacific 5,077.4 5,799.3 6,475.6 7,022.1 8,036.1 7,879.8 7,783.7 8,261.3 8,704.5<br />
Total world 41,255.7 45,540.0 47,545.1 50,052.8 54,579.0 53,706.7 52,303.7 55,559.8 58,067.9<br />
OPEC 2,740.4 3,176.5 3,207.8 3,086.3 3,413.9 3,333.9 2,985.1 3,347.7 3,540.2<br />
OPEC percentage 6.6 7.0 6.7 6.2 6.3 6.2 5.7 6.0 6.1<br />
1978 1979 1980 1981 1982 1983 1984 1985 1986<br />
North America 17,794.7 17,725.7 16,539.2 15,771.0 14,927.1 14,604.5 15,162.9 15,221.4 15,912.0<br />
Latin America 5,659.5 5,736.3 5,939.9 5,781.0 5,554.3 5,274.7 5,352.4 5,078.7 5,100.8<br />
Eastern Europe 9,536.9 10,036.4 10,626.9 10,453.8 10,375.4 10,459.8 10,018.1 9,848.9 10,702.5<br />
Western Europe 13,740.4 14,635.5 13,780.1 12,552.5 11,970.6 11,890.3 11,888.9 11,626.2 12,409.3<br />
Middle East 2,322.9 2,483.4 2,478.5 2,599.3 2,810.5 3,045.7 3,218.4 3,558.6 3,790.3<br />
Africa 1,167.3 1,200.4 1,397.2 1,531.2 1,704.5 1,736.2 1,724.7 1,735.6 1,826.5<br />
Asia and Pacific 9,145.6 9,426.9 9,181.0 8,892.5 8,698.9 8,884.6 8,984.9 8,818.0 9,085.3<br />
Total world 59,367.3 61,244.6 59,942.8 57,581.3 56,041.3 55,896.0 56,350.2 55,887.4 58,826.7<br />
OPEC 3,679.5 3,880.0 3,739.9 3,831.8 4,234.0 4,402.8 4,546.5 4,907.7 5,229.2<br />
OPEC percentage 6.2 6.3 6.2 6.7 7.6 7.9 8.1 8.8 8.9<br />
1987 1988 1989 1990 1991 1992 1993 1994 1995<br />
North America 16,162.6 16,639.3 16,860.7 16,986.4 16,911.2 17,013.5 17,522.4 17,628.6 17,833.2<br />
Latin America 5,226.3 5,356.4 5,554.8 5,706.2 5,777.4 5,910.4 6,045.3 6,258.2 6,223.7<br />
Eastern Europe 10,803.8 10,698.9 10,546.6 9,850.4 9,202.5 7,762.4 6,849.0 5,996.7 6,014.0<br />
Western Europe 12,298.4 12,844.9 12,868.7 13,234.6 13,436.9 13,829.2 13,930.0 14,266.8 14,241.7<br />
Middle East 3,847.6 4,057.9 4,102.4 4,278.5 3,696.4 4,117.2 4,409.1 4,864.9 4,881.3<br />
Africa 1,864.1 1,944.4 2,090.4 2,190.2 2,183.8 2,168.8 2,231.2 2,201.7 2,325.4<br />
Asia and Pacific 9,276.3 9,683.1 10,387.6 11,056.2 11,758.2 12,505.6 13,344.7 13,819.5 14,604.8<br />
Total world 59,479.1 61,224.8 62,411.2 63,302.6 62,966.5 63,307.1 64,331.9 65,036.3 66,124.1<br />
OPEC 5,244.7 5,665.0 5,870.2 6,153.3 5,559.2 5,850.3 6,276.6 6,661.7 6,907.0<br />
OPEC percentage 8.8 9.3 9.4 9.7 8.8 9.2 9.8 10.2 10.4<br />
1996 1997 1998 1999 2000 2001 2002 2003 2004<br />
North America 18,355.2 18,675.2 18,918.4 18,934.9 19,305.1 19,200.2 19,282.6 19,697.8 20,218.1<br />
Latin America 6,469.6 6,554.7 6,750.3 6,592.6 6,653.1 6,801.6 6,843.4 7,076.2 7,239.4<br />
Eastern Europe 5,814.7 5,839.8 5,768.0 5,697.9 5,828.0 6,165.4 6,543.4 6,652.3 6,835.4<br />
Western Europe 14,590.2 14,885.9 15,262.7 14,572.8 14,833.1 14,774.8 14,925.0 15,012.0 15,460.3<br />
Middle East 5,060.4 5,190.6 5,534.4 5,554.4 5,534.2 5,593.2 5,726.7 5,944.3 6,250.9<br />
Africa 2,360.1 2,365.1 2,298.6 2,376.3 2,404.8 2,583.5 2,738.7 2,678.5 2,786.2<br />
Asia and Pacific 15,540.9 16,351.5 16,306.8 17,256.7 17,843.9 17,941.8 18,176.5 18,173.9 18,780.8<br />
Total world 68,191.0 69,862.9 70,839.1 70,985.5 72,402.2 73,060.3 74,236.3 75,235.0 77,571.1<br />
OPEC 7,275.0 7,386.7 7,657.5 7,622.2 7,638.7 7,912.8 8,121.9 7,992.4 8,438.2<br />
OPEC percentage 10.7 10.6 10.8 10.7 10.6 10.8 10.9 10.6 10.9<br />
Notes: Totals may not add up due to independent rounding. Revisions have been made throughout the time series. Data excludes production of gas plants.


