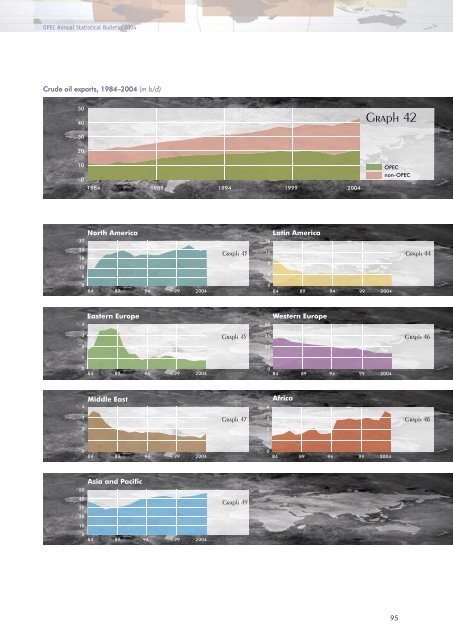
52 Table Oil and gas data 94 OPEC Annual Statistical Bulletin 2004 World crude oil exports by country, 2000–2004 (1,000 b/d) % change 2000 2001 2002 2003 2004* 04/03 North America 1,226.7 1,150.4 1,447.4 1,575.7 1,606.8 2.0 Canada 1,175.2 1,130.2 1,426.8 1,553.6 1,583.1 1.9 United States 51.5 20.2 20.6 22.1 23.7 7.1 Latin America 5,039.5 5,060.9 4,610.8 4,776.7 4,826.4 1.0 Colombia 608.0 576.0 566.5 564.1 566.9 0.5 Ecuador 219.4 243.0 239.6 246.2 247.7 0.6 Mexico 1,848.5 1,882.5 1,902.7 2,102.9 2,113.5 0.5 Trinidad & Tobago 60.2 62.7 60.3 60.2 60.3 0.1 Venezuela 2,003.5 1,964.7 1,572.0 1,535.0 1,566.2 2.0 Others 300.0 331.9 269.8 268.3 271.9 1.3 Eastern Europe 4,144.9 4,593.9 5,583.7 6,482.2 7,150.2 10.3 Former USSR 4,142.9 4,592.2 5,581.7 6,479.5 7,147.6 10.3 Others 2.0 1.7 2.0 2.7 2.7 0.1 Western Europe 4,960.4 4,853.9 4,765.2 4,373.3 4,173.6 –4.6 Norway 2,887.0 2,962.6 2,833.0 2,694.2 2,653.0 –1.5 United Kingdom 1,726.0 1,610.6 1,624.2 1,345.4 1,190.8 –11.5 Others 347.5 280.7 308.0 333.7 329.9 –1.1 Middle East 16,016.5 15,129.2 13,769.0 14,707.8 16,652.0 13.2 IR Iran 2,492.2 2,184.6 2,093.6 2,396.3 2,684.1 12.0 Iraq 2,039.8 1,710.2 1,494.6 388.6 1,450.0 273.1 Kuwait 1,230.7 1,214.1 1,138.0 1,242.9 1,414.9 13.8 Oman 905.0 917.0 908.0 901.9 905.5 0.4 Qatar 617.6 605.5 567.8 540.7 542.7 0.4 Saudi Arabia 6,253.1 6,035.9 5,284.6 6,522.9 6,813.1 4.4 Syrian Arab Republic 338.0 346.0 337.0 335.9 337.6 0.5 United Arab Emirates 1,814.9 1,786.7 1,614.0 2,048.0 2,172.0 6.1 Others 325.3 329.3 331.3 330.6 332.2 0.5 Africa 5,173.3 5,182.5 5,154.5 5,832.3 6,362.1 9.1 Algeria 461.1 441.5 566.2 741.0 893.2 20.5 Angola 668.9 660.2 697.6 698.2 722.6 3.5 Cameroon 107.9 111.7 121.7 120.7 120.9 0.2 Congo 249.8 250.0 256.0 253.5 254.3 0.3 Egypt 51.6 53.6 56.6 56.4 56.5 0.2 Gabon 308.2 315.0 314.9 312.7 313.3 0.2 SP Libyan AJ 1,005.0 987.6 983.6 1,126.5 1,284.5 14.0 Nigeria 1,986.4 2,009.4 1,798.2 2,163.5 2,356.0 8.9 Others 334.4 353.4 359.6 359.7 360.7 0.3 Asia and Pacific 2,266.2 2,212.8 2,244.1 1,975.5 1,921.0 –2.8 Australia 383.6 354.4 351.1 282.1 255.3 –9.5 Brunei 171.9 176.2 177.2 177.1 177.3 0.1 China 209.3 164.7 144.6 163.1 159.0 –2.5 Indonesia 622.5 599.2 639.9 433.0 412.7 –4.7 Malaysia 380.2 397.6 401.6 397.9 401.5 0.9 Vietnam 286.9 303.2 305.2 302.3 302.6 0.1 Others 211.7 217.5 224.6 219.9 212.6 –3.3 Total world 38,827.6 38,183.6 37,574.6 39,723.5 42,692.2 7.5 OPEC 20,526.7 19,539.4 17,752.6 19,138.4 21,589.3 12.8 OPEC percentage 52.9 51.2 47.2 48.2 50.6 Notes: Data includes re-exports. Revisions have been made throughout the time series.
OPEC Annual Statistical Bulletin 2004 95