

Download - Opec
Download - Opec
Download - Opec

Create successful ePaper yourself
Turn your PDF publications into a flip-book with our unique Google optimized e-Paper software.
48<br />
Table Oil and gas data<br />
80<br />
OPEC Annual Statistical Bulletin 2004<br />
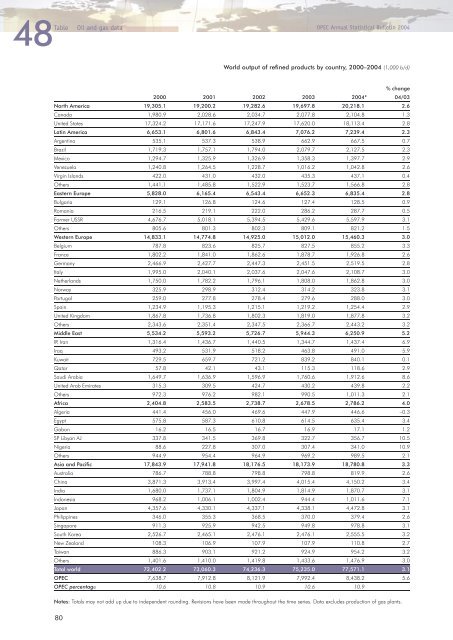
World output of refined products by country, 2000–2004 (1,000 b/d)<br />
% change<br />
2000 2001 2002 2003 2004* 04/03<br />
North America 19,305.1 19,200.2 19,282.6 19,697.8 20,218.1 2.6<br />
Canada 1,980.9 2,028.6 2,034.7 2,077.8 2,104.8 1.3<br />
United States 17,324.2 17,171.6 17,247.9 17,620.0 18,113.4 2.8<br />
Latin America 6,653.1 6,801.6 6,843.4 7,076.2 7,239.4 2.3<br />
Argentina 535.1 537.3 538.9 662.9 667.5 0.7<br />
Brazil 1,719.3 1,757.1 1,794.0 2,079.7 2,127.5 2.3<br />
Mexico 1,294.7 1,325.9 1,326.9 1,358.3 1,397.7 2.9<br />
Venezuela 1,240.8 1,264.5 1,228.7 1,016.2 1,042.8 2.6<br />
Virgin Islands 422.0 431.0 432.0 435.3 437.1 0.4<br />
Others 1,441.1 1,485.8 1,522.9 1,523.7 1,566.8 2.8<br />
Eastern Europe 5,828.0 6,165.4 6,543.4 6,652.3 6,835.4 2.8<br />
Bulgaria 129.1 126.8 124.6 127.4 128.5 0.9<br />
Romania 216.5 219.1 222.0 286.2 287.7 0.5<br />
Former USSR 4,676.7 5,018.1 5,394.5 5,429.6 5,597.9 3.1<br />
Others 805.6 801.3 802.3 809.1 821.2 1.5<br />
Western Europe 14,833.1 14,774.8 14,925.0 15,012.0 15,460.3 3.0<br />
Belgium 787.8 823.6 825.7 827.5 855.2 3.3<br />
France 1,802.2 1,841.0 1,862.6 1,878.7 1,926.8 2.6<br />
Germany 2,466.9 2,427.7 2,447.3 2,451.5 2,519.5 2.8<br />
Italy 1,995.0 2,040.1 2,037.6 2,047.6 2,108.7 3.0<br />
Netherlands 1,750.0 1,782.2 1,796.1 1,808.0 1,862.8 3.0<br />
Norway 325.9 298.9 312.4 314.2 323.8 3.1<br />
Portugal 259.0 277.8 278.4 279.6 288.0 3.0<br />
Spain 1,234.9 1,195.3 1,215.1 1,219.2 1,254.4 2.9<br />
United Kingdom 1,867.8 1,736.8 1,802.3 1,819.0 1,877.8 3.2<br />
Others 2,343.6 2,351.4 2,347.5 2,366.7 2,443.2 3.2<br />
Middle East 5,534.2 5,593.2 5,726.7 5,944.3 6,250.9 5.2<br />
IR Iran 1,316.4 1,436.7 1,440.5 1,344.7 1,437.4 6.9<br />
Iraq 493.2 531.9 518.2 463.8 491.0 5.9<br />
Kuwait 729.5 659.7 721.2 839.2 840.1 0.1<br />
Qatar 57.8 42.1 43.1 115.3 118.6 2.9<br />
Saudi Arabia 1,649.7 1,636.9 1,596.9 1,760.6 1,912.6 8.6<br />
United Arab Emirates 315.3 309.5 424.7 430.2 439.8 2.2<br />
Others 972.3 976.2 982.1 990.5 1,011.3 2.1<br />
Africa 2,404.8 2,583.5 2,738.7 2,678.5 2,786.2 4.0<br />
Algeria 441.4 456.0 469.6 447.9 446.6 –0.3<br />
Egypt 575.8 587.3 610.8 614.5 635.4 3.4<br />
Gabon 16.2 16.5 16.7 16.9 17.1 1.2<br />
SP Libyan AJ 337.8 341.5 369.8 322.7 356.7 10.5<br />
Nigeria 88.6 227.8 307.0 307.4 341.0 10.9<br />
Others 944.9 954.4 964.9 969.2 989.5 2.1<br />
Asia and Pacific 17,843.9 17,941.8 18,176.5 18,173.9 18,780.8 3.3<br />
Australia 786.7 788.8 798.8 798.8 819.9 2.6<br />
China 3,871.3 3,913.4 3,997.4 4,015.4 4,150.2 3.4<br />
India 1,680.0 1,737.1 1,804.9 1,814.9 1,870.7 3.1<br />
Indonesia 968.2 1,006.1 1,002.4 944.4 1,011.6 7.1<br />
Japan 4,357.6 4,330.1 4,337.1 4,338.1 4,472.8 3.1<br />
Philippines 346.0 355.3 368.5 370.0 379.4 2.6<br />
Singapore 911.3 925.9 942.5 949.8 978.8 3.1<br />
South Korea 2,526.7 2,465.1 2,476.1 2,476.1 2,555.5 3.2<br />
New Zealand 108.3 106.9 107.9 107.9 110.8 2.7<br />
Taiwan 886.3 903.1 921.2 924.9 954.2 3.2<br />
Others 1,401.6 1,410.0 1,419.8 1,433.6 1,476.9 3.0<br />
Total world 72,402.2 73,060.3 74,236.3 75,235.0 77,571.1 3.1<br />
OPEC 7,638.7 7,912.8 8,121.9 7,992.4 8,438.2 5.6<br />
OPEC percentage 10.6 10.8 10.9 10.6 10.9<br />
Notes: Totals may not add up due to independent rounding. Revisions have been made throughout the time series. Data excludes production of gas plants.


