

Download - Opec
Download - Opec
Download - Opec

You also want an ePaper? Increase the reach of your titles
YUMPU automatically turns print PDFs into web optimized ePapers that Google loves.
33<br />
Table Oil and gas data<br />
42<br />
OPEC Annual Statistical Bulletin 2004<br />
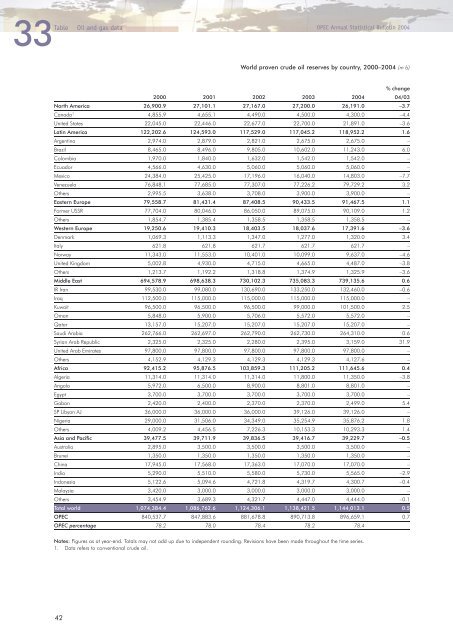
World proven crude oil reserves by country, 2000–2004 (m b)<br />
% change<br />
2000 2001 2002 2003 2004 04/03<br />
North America 26,900.9 27,101.1 27,167.0 27,200.0 26,191.0 –3.7<br />
Canada 1 4,855.9 4,655.1 4,490.0 4,500.0 4,300.0 –4.4<br />
United States 22,045.0 22,446.0 22,677.0 22,700.0 21,891.0 –3.6<br />
Latin America 122,202.6 124,593.0 117,529.0 117,045.2 118,952.2 1.6<br />
Argentina 2,974.0 2,879.0 2,821.0 2,675.0 2,675.0 –<br />
Brazil 8,465.0 8,496.0 9,805.0 10,602.0 11,243.0 6.0<br />
Colombia 1,970.0 1,840.0 1,632.0 1,542.0 1,542.0 –<br />
Ecuador 4,566.0 4,630.0 5,060.0 5,060.0 5,060.0 –<br />
Mexico 24,384.0 25,425.0 17,196.0 16,040.0 14,803.0 –7.7<br />
Venezuela 76,848.1 77,685.0 77,307.0 77,226.2 79,729.2 3.2<br />
Others 2,995.5 3,638.0 3,708.0 3,900.0 3,900.0 –<br />
Eastern Europe 79,558.7 81,431.4 87,408.5 90,433.5 91,467.5 1.1<br />
Former USSR 77,704.0 80,046.0 86,050.0 89,075.0 90,109.0 1.2<br />
Others 1,854.7 1,385.4 1,358.5 1,358.5 1,358.5 –<br />
Western Europe 19,250.6 19,410.3 18,403.5 18,037.6 17,391.6 –3.6<br />
Denmark 1,069.3 1,113.3 1,347.0 1,277.0 1,320.0 3.4<br />
Italy 621.8 621.8 621.7 621.7 621.7 –<br />
Norway 11,343.0 11,553.0 10,401.0 10,099.0 9,637.0 –4.6<br />
United Kingdom 5,002.8 4,930.0 4,715.0 4,665.0 4,487.0 –3.8<br />
Others 1,213.7 1,192.2 1,318.8 1,374.9 1,325.9 –3.6<br />
Middle East 694,578.9 698,638.3 730,102.3 735,083.3 739,135.6 0.6<br />
IR Iran 99,530.0 99,080.0 130,690.0 133,250.0 132,460.0 –0.6<br />
Iraq 112,500.0 115,000.0 115,000.0 115,000.0 115,000.0 –<br />
Kuwait 96,500.0 96,500.0 96,500.0 99,000.0 101,500.0 2.5<br />
Oman 5,848.0 5,900.0 5,706.0 5,572.0 5,572.0 –<br />
Qatar 13,157.0 15,207.0 15,207.0 15,207.0 15,207.0 –<br />
Saudi Arabia 262,766.0 262,697.0 262,790.0 262,730.0 264,310.0 0.6<br />
Syrian Arab Republic 2,325.0 2,325.0 2,280.0 2,395.0 3,159.0 31.9<br />
United Arab Emirates 97,800.0 97,800.0 97,800.0 97,800.0 97,800.0 –<br />
Others 4,152.9 4,129.3 4,129.3 4,129.3 4,127.6 –<br />
Africa 92,415.2 95,876.5 103,859.3 111,205.2 111,645.6 0.4<br />
Algeria 11,314.0 11,314.0 11,314.0 11,800.0 11,350.0 –3.8<br />
Angola 5,972.0 6,500.0 8,900.0 8,801.0 8,801.0 –<br />
Egypt 3,700.0 3,700.0 3,700.0 3,700.0 3,700.0 –<br />
Gabon 2,420.0 2,400.0 2,370.0 2,370.0 2,499.0 5.4<br />
SP Libyan AJ 36,000.0 36,000.0 36,000.0 39,126.0 39,126.0 –<br />
Nigeria 29,000.0 31,506.0 34,349.0 35,254.9 35,876.2 1.8<br />
Others 4,009.2 4,456.5 7,226.3 10,153.3 10,293.3 1.4<br />
Asia and Pacific 39,477.5 39,711.9 39,836.5 39,416.7 39,229.7 –0.5<br />
Australia 2,895.0 3,500.0 3,500.0 3,500.0 3,500.0 –<br />
Brunei 1,350.0 1,350.0 1,350.0 1,350.0 1,350.0 –<br />
China 17,945.0 17,568.0 17,363.0 17,070.0 17,070.0 –<br />
India 5,290.0 5,510.0 5,580.0 5,730.0 5,565.0 –2.9<br />
Indonesia 5,122.6 5,094.6 4,721.8 4,319.7 4,300.7 –0.4<br />
Malaysia 3,420.0 3,000.0 3,000.0 3,000.0 3,000.0 –<br />
Others 3,454.9 3,689.3 4,321.7 4,447.0 4,444.0 –0.1<br />
Total world 1,074,384.4 1,086,762.6 1,124,306.1 1,138,421.5 1,144,013.1 0.5<br />
OPEC 840,537.7 847,883.6 881,678.8 890,713.8 896,659.1 0.7<br />
OPEC percentage 78.2 78.0 78.4 78.2 78.4<br />
Notes: Figures as at year-end. Totals may not add up due to independent rounding. Revisions have been made throughout the time series.<br />
1. Data refers to conventional crude oil.


