30 Table Summary OPEC Annual Statistical Bulletin 2004 38 World exports of crude oil and refined products by region, 1969–2004 (1,000 b/d) 1969 1970 1971 1972 1973 1974 1975 1976 1977 North America 707.2 980.7 1,018.7 1,247.0 1,453.2 1,210.2 997.2 790.0 713.4 Latin America 4,909.9 5,168.8 5,032.3 4,945.4 5,386.7 4,863.5 3,949.5 4,084.7 4,033.6 Eastern Europe 1,928.8 2,006.5 2,161.5 2,226.6 2,445.0 2,413.7 2,701.9 3,212.2 3,431.7 Western Europe 1,908.7 2,533.9 2,537.7 2,789.0 3,075.9 2,711.9 2,495.0 2,785.7 3,166.8 Middle East 11,846.6 13,290.6 15,421.4 17,328.3 20,284.2 20,935.6 18,685.0 21,359.1 21,243.5 Africa 4,929.7 5,939.9 5,481.8 5,500.2 5,787.9 5,248.3 4,811.4 5,609.2 5,913.7 Asia and Pacific 1,179.1 1,359.7 1,528.8 1,789.4 2,061.2 2,079.8 2,016.8 2,350.2 2,612.3 Total world 27,410.0 31,280.1 33,182.2 35,825.9 40,494.1 39,463.0 35,656.8 40,191.1 41,115.0 OPEC 19,667.2 22,100.5 23,736.2 25,682.9 29,192.0 28,792.9 25,265.6 28,946.8 29,060.5 OPEC percentage 71.8 70.7 71.5 71.7 72.1 73.0 70.9 72.0 70.7 1978 1979 1980 1981 1982 1983 1984 1985 1986 North America 818.4 998.6 989.6 997.1 1,247.2 1,248.8 1,311.3 1,505.4 1,549.4 Latin America 4,053.7 4,308.9 4,429.9 4,479.8 4,598.6 4,574.5 4,578.8 4,086.5 4,103.5 Eastern Europe 3,453.0 3,649.8 3,775.0 3,764.2 3,843.5 4,015.5 4,026.5 3,671.4 4,088.0 Western Europe 3,369.9 4,037.2 3,997.8 4,245.7 4,607.6 5,015.9 5,239.4 5,336.4 5,860.5 Middle East 20,191.6 20,664.9 17,610.5 15,016.4 11,786.3 9,954.1 9,421.8 8,452.4 10,523.3 Africa 5,636.9 6,109.6 5,473.3 3,913.8 3,542.5 3,471.3 3,833.3 4,187.0 4,262.4 Asia and Pacific 2,683.9 2,667.5 2,609.4 2,571.8 2,623.5 2,787.9 3,174.0 3,110.8 3,254.9 Total world 40,207.4 42,436.5 38,885.5 34,988.8 32,249.2 31,067.9 31,585.1 30,349.9 33,642.0 OPEC 27,657.4 28,584.6 24,512.9 20,204.5 16,228.3 14,193.4 13,915.8 12,751.2 15,085.3 OPEC percentage 68.8 67.4 63.0 57.7 50.3 45.7 44.1 42.0 44.8 1987 1988 1989 1990 1991 1992 1993 1994 1995 North America 1,600.4 1,820.3 1,794.1 1,834.8 2,109.5 2,114.3 2,139.2 2,205.0 2,261.6 Latin America 4,193.5 4,335.0 4,367.6 4,652.4 4,974.8 5,009.7 5,321.7 5,530.3 5,835.5 Eastern Europe 4,269.0 4,384.3 4,021.2 3,302.5 2,211.2 2,239.5 2,715.0 2,896.2 2,896.3 Western Europe 5,842.9 5,844.2 5,904.3 6,288.5 6,608.9 7,034.1 7,522.9 8,262.5 7,974.9 Middle East 10,634.6 12,276.4 13,919.9 14,588.9 14,443.1 15,641.8 16,439.9 16,529.7 16,819.2 Africa 3,997.2 4,173.5 4,776.0 5,192.7 5,477.2 5,445.4 5,360.9 5,254.2 5,439.3 Asia and Pacific 3,214.1 3,247.7 3,418.3 3,707.4 3,969.1 4,049.9 4,213.6 4,390.1 4,629.0 Total world 33,751.7 36,081.4 38,201.4 39,567.2 39,793.7 41,534.8 43,713.3 45,068.0 45,855.8 OPEC 14,627.4 16,290.8 18,385.8 19,517.9 19,916.3 20,809.1 21,488.5 21,818.2 22,318.1 OPEC percentage 43.3 45.2 48.1 49.3 50.0 50.1 49.2 48.4 48.7 1996 1997 1998 1999 2000 2001 2002 2003 2004* North America 2,361.0 2,369.9 2,373.0 2,282.3 2,501.4 2,527.9 2,862.0 3,057.8 3,165.0 Latin America 6,418.0 7,049.9 7,310.7 6,822.3 7,133.8 7,262.0 6,613.3 6,845.3 6,982.5 Eastern Europe 3,219.7 3,355.5 4,110.1 4,530.4 5,417.2 6,050.0 7,384.4 8,361.3 9,082.9 Western Europe 8,321.9 8,554.6 8,533.4 8,672.1 9,131.4 9,024.9 8,987.2 8,939.3 8,985.9 Middle East 17,017.3 17,826.1 18,881.9 18,449.1 19,156.8 18,091.8 16,644.9 17,804.5 19,947.2 Africa 5,747.4 6,085.2 6,184.3 6,025.9 6,346.0 6,396.0 6,348.2 6,946.2 7,415.1 Asia and Pacific 4,883.0 5,206.4 5,091.7 5,048.3 5,054.6 5,016.4 4,813.9 4,714.6 4,747.1 Total world 47,968.5 50,447.5 52,485.1 51,830.5 54,741.2 54,369.0 53,653.9 56,668.9 60,325.6 OPEC 22,783.7 23,935.7 25,166.9 24,150.8 25,063.5 23,877.2 21,770.2 23,190.6 25,839.1 OPEC percentage 47.5 47.4 48.0 46.6 45.8 43.9 40.6 40.9 42.8 Notes: Data includes re-exports and exports of petroleum products from gas plants. Revisions have been made throughout the time series.
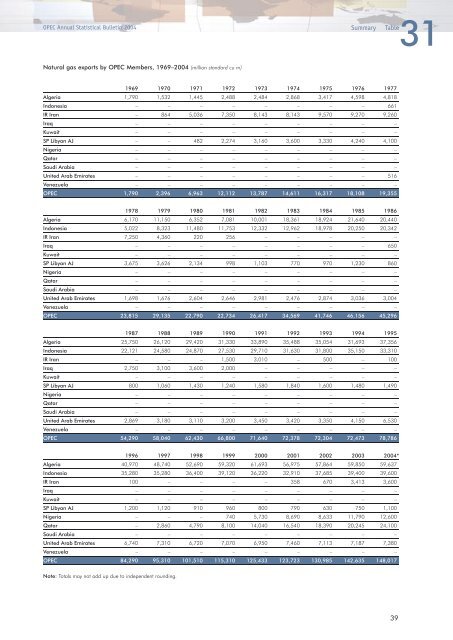
31 OPEC Annual Statistical Bulletin 2004 Summary Table Natural gas exports by OPEC Members, 1969–2004 (million standard cu m) 1969 1970 1971 1972 1973 1974 1975 1976 1977 Algeria 1,790 1,532 1,445 2,488 2,484 2,868 3,417 4,598 4,818 Indonesia – – – – – – – – 661 IR Iran – 864 5,036 7,350 8,143 8,143 9,570 9,270 9,260 Iraq – – – – – – – – – Kuwait – – – – – – – – – SP Libyan AJ – – 482 2,274 3,160 3,600 3,330 4,240 4,100 Nigeria – – – – – – – – – Qatar – – – – – – – – – Saudi Arabia – – – – – – – – – United Arab Emirates – – – – – – – – 516 Venezuela – – – – – – – – – OPEC 1,790 2,396 6,963 12,112 13,787 14,611 16,317 18,108 19,355 1978 1979 1980 1981 1982 1983 1984 1985 1986 Algeria 6,170 11,150 6,352 7,081 10,001 18,361 18,924 21,640 20,440 Indonesia 5,022 8,323 11,480 11,753 12,332 12,962 18,978 20,250 20,342 IR Iran 7,250 4,360 220 256 – – – – – Iraq – – – – – – – – 650 Kuwait – – – – – – – – – SP Libyan AJ 3,675 3,626 2,134 998 1,103 770 970 1,230 860 Nigeria – – – – – – – – – Qatar – – – – – – – – – Saudi Arabia – – – – – – – – – United Arab Emirates 1,698 1,676 2,604 2,646 2,981 2,476 2,874 3,036 3,004 Venezuela – – – – – – – – – OPEC 23,815 29,135 22,790 22,734 26,417 34,569 41,746 46,156 45,296 1987 1988 1989 1990 1991 1992 1993 1994 1995 Algeria 25,750 26,120 29,420 31,330 33,890 35,488 35,054 31,693 37,356 Indonesia 22,121 24,580 24,870 27,530 29,710 31,630 31,800 35,150 33,310 IR Iran – – – 1,500 3,010 – 500 – 100 Iraq 2,750 3,100 3,600 2,000 – – – – – Kuwait – – – – – – – – – SP Libyan AJ 800 1,060 1,430 1,240 1,580 1,840 1,600 1,480 1,490 Nigeria – – – – – – – – – Qatar – – – – – – – – – Saudi Arabia – – – – – – – – – United Arab Emirates 2,869 3,180 3,110 3,200 3,450 3,420 3,350 4,150 6,530 Venezuela – – – – – – – – – OPEC 54,290 58,040 62,430 66,800 71,640 72,378 72,304 72,473 78,786 1996 1997 1998 1999 2000 2001 2002 2003 2004* Algeria 40,970 48,740 52,690 59,320 61,693 56,975 57,864 59,850 59,637 Indonesia 35,280 35,280 36,400 39,120 36,220 32,910 37,685 39,400 39,600 IR Iran 100 – – – – 358 670 3,413 3,600 Iraq – – – – – – – – – Kuwait – – – – – – – – – SP Libyan AJ 1,200 1,120 910 960 800 790 630 750 1,100 Nigeria – – – 740 5,730 8,690 8,633 11,790 12,600 Qatar – 2,860 4,790 8,100 14,040 16,540 18,390 20,245 24,100 Saudi Arabia – – – – – – – – – United Arab Emirates 6,740 7,310 6,720 7,070 6,950 7,460 7,113 7,187 7,380 Venezuela – – – – – – – – – OPEC 84,290 95,310 101,510 115,310 125,433 123,723 130,985 142,635 148,017 Note: Totals may not add up due to independent rounding. 39