

Download - Opec
Download - Opec
Download - Opec

Create successful ePaper yourself
Turn your PDF publications into a flip-book with our unique Google optimized e-Paper software.
18<br />
Table Summary OPEC Annual Statistical Bulletin 2004<br />
26<br />
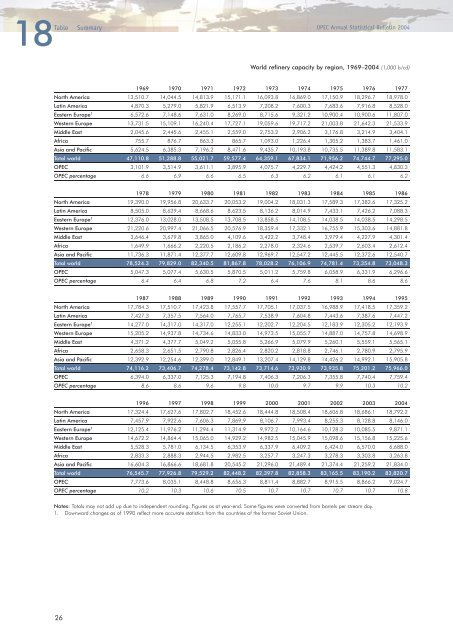
World refinery capacity by region, 1969–2004 (1,000 b/cd)<br />
1969 1970 1971 1972 1973 1974 1975 1976 1977<br />
North America 13,510.7 14,044.5 14,813.9 15,171.1 16,093.8 16,869.0 17,150.9 18,296.7 18,978.0<br />
Latin America 4,870.3 5,279.0 5,821.9 6,513.9 7,208.2 7,600.3 7,683.6 7,916.8 8,528.0<br />
Eastern Europe 1 6,572.6 7,148.6 7,631.0 8,269.0 8,715.6 9,321.2 10,900.4 10,900.6 11,807.0<br />
Western Europe 13,731.5 15,109.1 16,240.4 17,727.1 19,059.6 19,717.2 21,003.8 21,642.3 21,533.9<br />
Middle East 2,045.6 2,445.6 2,455.1 2,559.0 2,753.2 2,906.2 3,176.8 3,214.9 3,404.1<br />
Africa 755.7 876.7 863.3 865.7 1,093.0 1,226.4 1,305.2 1,383.7 1,461.0<br />
Asia and Pacific 5,624.5 6,385.3 7,196.2 8,471.6 9,435.7 10,193.8 10,735.5 11,389.8 11,583.1<br />
Total world 47,110.8 51,288.8 55,021.7 59,577.4 64,359.1 67,834.1 71,956.2 74,744.7 77,295.0<br />
OPEC 3,101.9 3,514.9 3,611.1 3,895.9 4,075.7 4,229.7 4,424.2 4,551.3 4,830.3<br />
OPEC percentage 6.6 6.9 6.6 6.5 6.3 6.2 6.1 6.1 6.2<br />
1978 1979 1980 1981 1982 1983 1984 1985 1986<br />
North America 19,390.0 19,956.8 20,633.7 20,053.2 19,004.2 18,031.3 17,589.3 17,382.6 17,325.2<br />
Latin America 8,505.0 8,629.4 8,668.6 8,623.5 8,136.2 8,014.9 7,433.1 7,426.2 7,088.3<br />
Eastern Europe 1 12,376.0 13,028.0 13,508.5 13,708.5 13,858.5 14,108.5 14,038.5 14,038.5 14,298.5<br />
Western Europe 21,220.6 20,997.4 21,066.5 20,576.9 18,359.4 17,332.1 16,755.9 15,303.6 14,881.8<br />
Middle East 3,646.4 3,679.8 3,865.0 4,109.6 3,422.2 3,748.4 3,979.4 4,227.9 4,301.4<br />
Africa 1,649.9 1,666.2 2,220.5 2,186.2 2,278.0 2,324.6 2,539.7 2,603.4 2,612.4<br />
Asia and Pacific 11,736.3 11,871.4 12,377.7 12,609.8 12,969.7 12,547.2 12,445.5 12,372.6 12,540.7<br />
Total world 78,524.3 79,829.0 82,340.5 81,867.8 78,028.2 76,106.9 74,781.4 73,354.8 73,048.3<br />
OPEC 5,047.3 5,077.4 5,630.5 5,870.5 5,011.2 5,759.8 6,058.9 6,331.9 6,296.6<br />
OPEC percentage 6.4 6.4 6.8 7.2 6.4 7.6 8.1 8.6 8.6<br />
1987 1988 1989 1990 1991 1992 1993 1994 1995<br />
North America 17,784.3 17,510.7 17,423.8 17,557.7 17,705.1 17,037.5 16,988.9 17,418.5 17,359.2<br />
Latin America 7,427.3 7,357.5 7,564.0 7,765.7 7,538.9 7,604.8 7,443.6 7,387.6 7,447.2<br />
Eastern Europe 1 14,277.0 14,317.0 14,317.0 12,255.1 12,202.7 12,204.5 12,183.9 12,305.2 12,193.9<br />
Western Europe 15,205.2 14,937.8 14,734.6 14,833.0 14,973.5 15,055.7 14,887.0 14,757.8 14,698.9<br />
Middle East 4,371.2 4,377.7 5,049.2 5,055.8 5,266.9 5,079.9 5,260.1 5,559.1 5,565.1<br />
Africa 2,658.3 2,651.5 2,790.8 2,826.4 2,820.2 2,818.8 2,746.1 2,780.9 2,795.9<br />
Asia and Pacific 12,392.9 12,254.6 12,399.0 12,849.1 13,207.4 14,129.8 14,426.2 14,992.1 15,905.8<br />
Total world 74,116.2 73,406.7 74,278.4 73,142.8 73,714.6 73,930.9 73,935.8 75,201.2 75,966.0<br />
OPEC 6,394.0 6,337.0 7,125.3 7,194.8 7,406.3 7,206.3 7,355.8 7,740.4 7,759.4<br />
OPEC percentage 8.6 8.6 9.6 9.8 10.0 9.7 9.9 10.3 10.2<br />
1996 1997 1998 1999 2000 2001 2002 2003 2004<br />
North America 17,324.4 17,627.6 17,802.7 18,452.6 18,444.8 18,508.4 18,606.8 18,686.1 18,792.2<br />
Latin America 7,457.9 7,922.6 7,606.3 7,869.9 8,106.7 7,993.4 8,255.3 8,128.8 8,146.0<br />
Eastern Europe 1 12,125.4 11,976.2 11,294.4 11,314.9 9,972.2 10,164.6 10,128.3 10,085.5 9,871.1<br />
Western Europe 14,672.2 14,864.4 15,065.0 14,929.2 14,982.5 15,045.9 15,098.6 15,156.8 15,225.6<br />
Middle East 5,528.3 5,781.0 6,134.5 6,353.9 6,337.9 6,409.2 6,424.0 6,570.0 6,688.0<br />
Africa 2,833.3 2,888.3 2,944.5 2,982.5 3,257.7 3,247.3 3,278.3 3,303.8 3,263.8<br />
Asia and Pacific 16,604.3 16,866.6 18,681.8 20,545.2 21,296.0 21,489.4 21,374.4 21,259.2 21,834.0<br />
Total world 76,545.7 77,926.8 79,529.2 82,448.2 82,397.8 82,858.3 83,165.5 83,190.2 83,820.7<br />
OPEC 7,773.6 8,035.1 8,448.8 8,656.3 8,811.4 8,882.7 8,915.5 8,866.2 9,024.7<br />
OPEC percentage 10.2 10.3 10.6 10.5 10.7 10.7 10.7 10.7 10.8<br />
Notes: Totals may not add up due to independent rounding. Figures as at year-end. Some figures were converted from barrels per stream day.<br />
1. Downward changes as of 1990 reflect more accurate statistics from the countries of the former Soviet Union.


