

Download - Opec
Download - Opec
Download - Opec

You also want an ePaper? Increase the reach of your titles
YUMPU automatically turns print PDFs into web optimized ePapers that Google loves.
80<br />
OPEC Annual Statistical Bulletin 2004 Major oil companies Table<br />
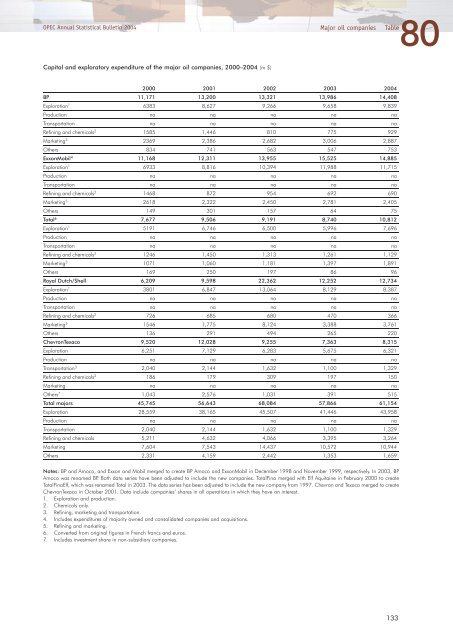
Capital and exploratory expenditure of the major oil companies, 2000–2004 (m $)<br />
2000 2001 2002 2003 2004<br />
BP 11,171 13,200 13,321 13,986 14,408<br />
Exploration 1 6383 8,627 9,266 9,658 9,839<br />
Production na na na na na<br />
Transportation na na na na na<br />
Refining and chemicals 2 1585 1,446 810 775 929<br />
Marketing 3 2369 2,386 2,682 3,006 2,887<br />
Others 834 741 563 547 753<br />
ExxonMobil 4 11,168 12,311 13,955 15,525 14,885<br />
Exploration 1 6933 8,816 10,394 11,988 11,715<br />
Production na na na na na<br />
Transportation na na na na na<br />
Refining and chemicals 2 1468 872 954 692 690<br />
Marketing 5 2618 2,322 2,450 2,781 2,405<br />
Others 149 301 157 64 75<br />
Total 6 7,677 9,506 9,191 8,740 10,812<br />
Exploration 1 5191 6,746 6,500 5,996 7,696<br />
Production na na na na na<br />
Transportation na na na na na<br />
Refining and chemicals 2 1246 1,450 1,313 1,261 1,129<br />
Marketing 3 1071 1,060 1,181 1,397 1,891<br />
Others 169 250 197 86 96<br />
Royal Dutch/Shell 6,209 9,598 22,362 12,252 12,734<br />
Exploration 1 3801 6,847 13,064 8,129 8,387<br />
Production na na na na na<br />
Transportation na na na na na<br />
Refining and chemicals 2 726 685 680 470 366<br />
Marketing 5 1546 1,775 8,124 3,388 3,761<br />
Others 136 291 494 265 220<br />
ChevronTexaco 9,520 12,028 9,255 7,363 8,315<br />
Exploration 6,251 7,129 6,283 5,675 6,321<br />
Production na na na na na<br />
Transportation 3 2,040 2,144 1,632 1,100 1,329<br />
Refining and chemicals 2 186 179 309 197 150<br />
Marketing na na na na na<br />
Others 7 1,043 2,576 1,031 391 515<br />
Total majors 45,745 56,643 68,084 57,866 61,154<br />
Exploration 28,559 38,165 45,507 41,446 43,958<br />
Production na na na na na<br />
Transportation 2,040 2,144 1,632 1,100 1,329<br />
Refining and chemicals 5,211 4,632 4,066 3,395 3,264<br />
Marketing 7,604 7,543 14,437 10,572 10,944<br />
Others 2,331 4,159 2,442 1,353 1,659<br />
Notes: BP and Amoco, and Exxon and Mobil merged to create BP Amoco and ExxonMobil in December 1998 and November 1999, respectively. In 2003, BP<br />
Amoco was renamed BP. Both data series have been adjusted to include the new companies. TotalFina merged with Elf Aquitaine in February 2000 to create<br />
TotalFinaElf, which was renamed Total in 2003. The data series has been adjusted to include the new company from 1997. Chevron and Texaco merged to create<br />
ChevronTexaco in October 2001. Data include companies’ shares in all operations in which they have an interest.<br />
1. Exploration and production.<br />
2. Chemicals only.<br />
3. Refining, marketing and transportation.<br />
4. Includes expenditures of majority owned and consolidated companies and acquisitions.<br />
5. Refining and marketing.<br />
6. Converted from original figures in French francs and euros.<br />
7. Includes investment share in non-subsidiary companies.<br />
133


