

Appendix 2 - Vegetation Communities and Regional Ecosystems
Appendix 2 - Vegetation Communities and Regional Ecosystems
Appendix 2 - Vegetation Communities and Regional Ecosystems

You also want an ePaper? Increase the reach of your titles
YUMPU automatically turns print PDFs into web optimized ePapers that Google loves.
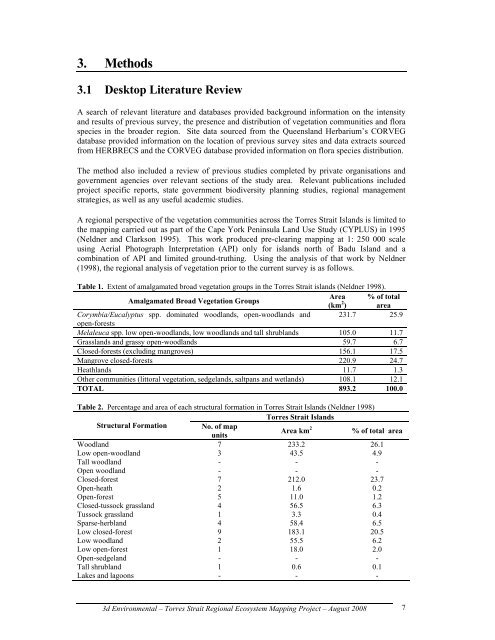
3. Methods<br />
3.1 Desktop Literature Review<br />
A search of relevant literature <strong>and</strong> databases provided background information on the intensity<br />
<strong>and</strong> results of previous survey, the presence <strong>and</strong> distribution of vegetation communities <strong>and</strong> flora<br />
species in the broader region. Site data sourced from the Queensl<strong>and</strong> Herbarium’s CORVEG<br />
database provided information on the location of previous survey sites <strong>and</strong> data extracts sourced<br />
from HERBRECS <strong>and</strong> the CORVEG database provided information on flora species distribution.<br />
The method also included a review of previous studies completed by private organisations <strong>and</strong><br />
government agencies over relevant sections of the study area. Relevant publications included<br />
project specific reports, state government biodiversity planning studies, regional management<br />
strategies, as well as any useful academic studies.<br />
A regional perspective of the vegetation communities across the Torres Strait Isl<strong>and</strong>s is limited to<br />
the mapping carried out as part of the Cape York Peninsula L<strong>and</strong> Use Study (CYPLUS) in 1995<br />
(Neldner <strong>and</strong> Clarkson 1995). This work produced pre-clearing mapping at 1: 250 000 scale<br />
using Aerial Photograph Interpretation (API) only for isl<strong>and</strong>s north of Badu Isl<strong>and</strong> <strong>and</strong> a<br />
combination of API <strong>and</strong> limited ground-truthing. Using the analysis of that work by Neldner<br />
(1998), the regional analysis of vegetation prior to the current survey is as follows.<br />
Table 1. Extent of amalgamated broad vegetation groups in the Torres Strait isl<strong>and</strong>s (Neldner 1998).<br />
Amalgamated Broad <strong>Vegetation</strong> Groups<br />
Area<br />
(km 2 )<br />
% of total<br />
area<br />
Corymbia/Eucalyptus spp. dominated woodl<strong>and</strong>s, open-woodl<strong>and</strong>s <strong>and</strong><br />
open-forests<br />
231.7 25.9<br />
Melaleuca spp. low open-woodl<strong>and</strong>s, low woodl<strong>and</strong>s <strong>and</strong> tall shrubl<strong>and</strong>s 105.0 11.7<br />
Grassl<strong>and</strong>s <strong>and</strong> grassy open-woodl<strong>and</strong>s 59.7 6.7<br />
Closed-forests (excluding mangroves) 156.1 17.5<br />
Mangrove closed-forests 220.9 24.7<br />
Heathl<strong>and</strong>s 11.7 1.3<br />
Other communities (littoral vegetation, sedgel<strong>and</strong>s, saltpans <strong>and</strong> wetl<strong>and</strong>s) 108.1 12.1<br />
TOTAL 893.2 100.0<br />
Table 2. Percentage <strong>and</strong> area of each structural formation in Torres Strait Isl<strong>and</strong>s (Neldner 1998)<br />
Torres Strait Isl<strong>and</strong>s<br />
Structural Formation No. of map<br />
Area km 2 % of total area<br />
Woodl<strong>and</strong><br />
Low open-woodl<strong>and</strong><br />
Tall woodl<strong>and</strong><br />
Open woodl<strong>and</strong><br />
Closed-forest<br />
Open-heath<br />
Open-forest<br />
Closed-tussock grassl<strong>and</strong><br />
Tussock grassl<strong>and</strong><br />
Sparse-herbl<strong>and</strong><br />
Low closed-forest<br />
Low woodl<strong>and</strong><br />
Low open-forest<br />
Open-sedgel<strong>and</strong><br />
Tall shrubl<strong>and</strong><br />
Lakes <strong>and</strong> lagoons<br />
units<br />
7<br />
3<br />
-<br />
-<br />
7<br />
2<br />
5<br />
4<br />
1<br />
4<br />
9<br />
2<br />
1<br />
-<br />
1<br />
-<br />
233.2<br />
43.5<br />
-<br />
-<br />
212.0<br />
1.6<br />
11.0<br />
56.5<br />
3.3<br />
58.4<br />
183.1<br />
55.5<br />
18.0<br />
-<br />
0.6<br />
-<br />
3d Environmental – Torres Strait <strong>Regional</strong> Ecosystem Mapping Project – August 2008<br />
26.1<br />
4.9<br />
-<br />
-<br />
23.7<br />
0.2<br />
1.2<br />
6.3<br />
0.4<br />
6.5<br />
20.5<br />
6.2<br />
2.0<br />
-<br />
0.1<br />
-<br />
7