Australia Post Annual Report 2008–09
Australia Post Annual Report 2008–09
Australia Post Annual Report 2008–09

Create successful ePaper yourself
Turn your PDF publications into a flip-book with our unique Google optimized e-Paper software.
Notes to and forming part of the Financial <strong>Report</strong> for the year ended 30 June 2009<br />
29 Financial and capital risk management (continued)<br />
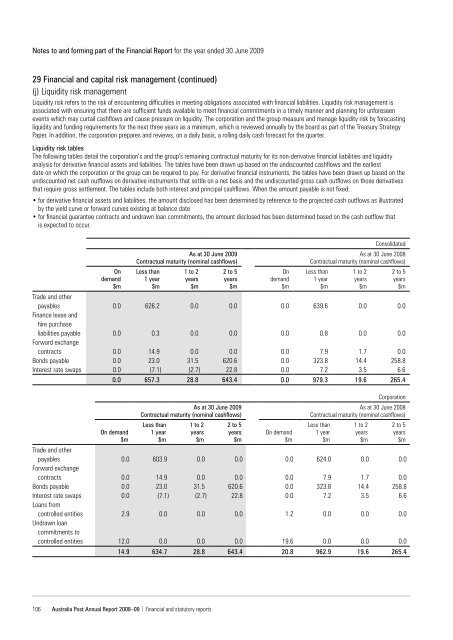
(j) Liquidity risk management<br />
Liquidity risk refers to the risk of encountering difficulties in meeting obligations associated with financial liabilities. Liquidity risk management is<br />
associated with ensuring that there are sufficient funds available to meet financial commitments in a timely manner and planning for unforeseen<br />
events which may curtail cashflows and cause pressure on liquidity. The corporation and the group measure and manage liquidity risk by forecasting<br />
liquidity and funding requirements for the next three years as a minimum, which is reviewed annually by the board as part of the Treasury Strategy<br />
Paper. In addition, the corporation prepares and reviews, on a daily basis, a rolling daily cash forecast for the quarter.<br />
Liquidity risk tables<br />
The following tables detail the corporation’s and the group’s remaining contractual maturity for its non-derivative financial liabilities and liquidity<br />
analysis for derivative financial assets and liabilities. The tables have been drawn up based on the undiscounted cashflows and the earliest<br />
date on which the corporation or the group can be required to pay. For derivative financial instruments, the tables have been drawn up based on the<br />
undiscounted net cash outflows on derivative instruments that settle on a net basis and the undiscounted gross cash outflows on those derivatives<br />
that require gross settlement. The tables include both interest and principal cashflows. When the amount payable is not fixed:<br />
• for derivative financial assets and liabilities, the amount disclosed has been determined by reference to the projected cash outflows as illustrated<br />
by the yield curve or forward curves existing at balance date<br />
• for financial guarantee contracts and undrawn loan commitments, the amount disclosed has been determined based on the cash outflow that<br />
is expected to occur.<br />
Trade and other<br />
payables<br />
Finance lease and<br />
hire purchase<br />
liabilities payable<br />
Forward exchange<br />
contracts<br />
Bonds payable<br />
Interest rate swaps<br />
Trade and other<br />
payables<br />
Forward exchange<br />
contracts<br />
Bonds payable<br />
Interest rate swaps<br />
Loans from<br />
controlled entities<br />
Undrawn loan<br />
commitments to<br />
controlled entities<br />
106<br />
On<br />
demand<br />
$m<br />
0.0<br />
0.0<br />
0.0<br />
0.0<br />
0.0<br />
As at 30 June 2009<br />
Contractual maturity (nominal cashflows)<br />
Less than<br />
1 year<br />
$m<br />
626.2<br />
1 to 2<br />
years<br />
$m<br />
<strong>Australia</strong> <strong>Post</strong> <strong>Annual</strong> <strong>Report</strong> <strong>2008–09</strong> | Financial and statutory reports<br />
0.3<br />
14.9<br />
23.0<br />
(7.1)<br />
0.0<br />
0.0<br />
0.0<br />
31.5<br />
(2.7)<br />
2 to 5<br />
years<br />
$m<br />
0.0<br />
0.0<br />
0.0<br />
620.6<br />
22.8<br />
On<br />
demand<br />
$m<br />
0.0<br />
0.0<br />
0.0<br />
0.0<br />
0.0<br />
Consolidated<br />
As at 30 June 2008<br />
Contractual maturity (nominal cashflows)<br />
Less than<br />
1 year<br />
$m<br />
639.6<br />
0.8<br />
7.9<br />
323.8<br />
7.2<br />
1 to 2<br />
years<br />
$m<br />
0.0<br />
0.0<br />
1.7<br />
14.4<br />
3.5<br />
2 to 5<br />
years<br />
$m<br />
0.0<br />
0.0<br />
0.0<br />
258.8<br />
6.6<br />
0.0 657.3 28.8 643.4 0.0 979.3 19.6 265.4<br />
On demand<br />
$m<br />
0.0<br />
0.0<br />
0.0<br />
0.0<br />
2.9<br />
12.0<br />
As at 30 June 2009<br />
Contractual maturity (nominal cashflows)<br />
Less than<br />
1 year<br />
$m<br />
603.9<br />
14.9<br />
23.0<br />
(7.1)<br />
0.0<br />
0.0<br />
1 to 2<br />
years<br />
$m<br />
0.0<br />
0.0<br />
31.5<br />
(2.7)<br />
0.0<br />
0.0<br />
2 to 5<br />
years<br />
$m<br />
0.0<br />
0.0<br />
620.6<br />
22.8<br />
0.0<br />
0.0<br />
On demand<br />
$m<br />
0.0<br />
0.0<br />
0.0<br />
0.0<br />
1.2<br />
19.6<br />
Corporation<br />
As at 30 June 2008<br />
Contractual maturity (nominal cashflows)<br />
Less than<br />
1 year<br />
$m<br />
624.0<br />
7.9<br />
323.8<br />
7.2<br />
0.0<br />
0.0<br />
1 to 2<br />
years<br />
$m<br />
0.0<br />
1.7<br />
14.4<br />
3.5<br />
0.0<br />
0.0<br />
2 to 5<br />
years<br />
$m<br />
0.0<br />
0.0<br />
258.8<br />
6.6<br />
14.9 634.7 28.8 643.4 20.8 962.9 19.6 265.4<br />
0.0<br />
0.0