

Projecting Fatalities in Crashes Involving Older Drivers, 2000-2025
Projecting Fatalities in Crashes Involving Older Drivers, 2000-2025
Projecting Fatalities in Crashes Involving Older Drivers, 2000-2025

You also want an ePaper? Increase the reach of your titles
YUMPU automatically turns print PDFs into web optimized ePapers that Google loves.
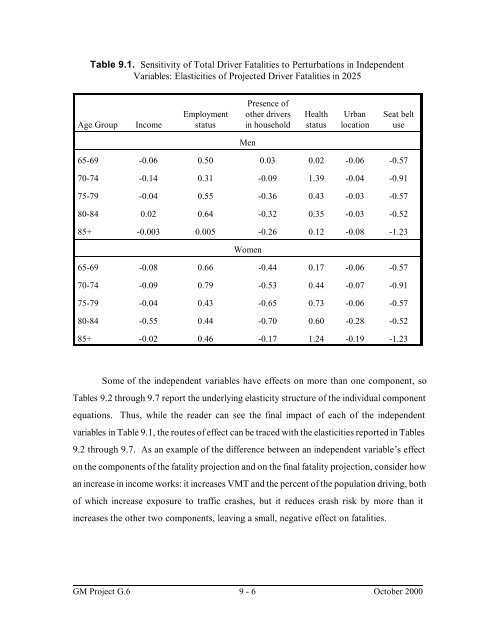
Table 9.1. Sensitivity of Total Driver <strong>Fatalities</strong> to Perturbations <strong>in</strong> Independent<br />
Variables: Elasticities of Projected Driver <strong>Fatalities</strong> <strong>in</strong> <strong>2025</strong><br />
Age Group Income<br />
Employment<br />
status<br />
Presence of<br />
other drivers<br />
<strong>in</strong> household<br />
Men<br />
Health<br />
status<br />
Urban<br />
location<br />
Seat belt<br />
use<br />
65-69 -0.06 0.50 0.03 0.02 -0.06 -0.57<br />
70-74 -0.14 0.31 -0.09 1.39 -0.04 -0.91<br />
75-79 -0.04 0.55 -0.36 0.43 -0.03 -0.57<br />
80-84 0.02 0.64 -0.32 0.35 -0.03 -0.52<br />
85+ -0.003 0.005 -0.26 0.12 -0.08 -1.23<br />
Women<br />
65-69 -0.08 0.66 -0.44 0.17 -0.06 -0.57<br />
70-74 -0.09 0.79 -0.53 0.44 -0.07 -0.91<br />
75-79 -0.04 0.43 -0.65 0.73 -0.06 -0.57<br />
80-84 -0.55 0.44 -0.70 0.60 -0.28 -0.52<br />
85+ -0.02 0.46 -0.17 1.24 -0.19 -1.23<br />
Some of the <strong>in</strong>dependent variables have effects on more than one component, so<br />
Tables 9.2 through 9.7 report the underly<strong>in</strong>g elasticity structure of the <strong>in</strong>dividual component<br />
equations. Thus, while the reader can see the f<strong>in</strong>al impact of each of the <strong>in</strong>dependent<br />
variables <strong>in</strong> Table 9.1, the routes of effect can be traced with the elasticities reported <strong>in</strong> Tables<br />
9.2 through 9.7. As an example of the difference between an <strong>in</strong>dependent variable’s effect<br />
on the components of the fatality projection and on the f<strong>in</strong>al fatality projection, consider how<br />
an <strong>in</strong>crease <strong>in</strong> <strong>in</strong>come works: it <strong>in</strong>creases VMT and the percent of the population driv<strong>in</strong>g, both<br />
of which <strong>in</strong>crease exposure to traffic crashes, but it reduces crash risk by more than it<br />
<strong>in</strong>creases the other two components, leav<strong>in</strong>g a small, negative effect on fatalities.<br />
GM Project G.6 9 - 6<br />
October <strong>2000</strong>


