

Projecting Fatalities in Crashes Involving Older Drivers, 2000-2025
Projecting Fatalities in Crashes Involving Older Drivers, 2000-2025
Projecting Fatalities in Crashes Involving Older Drivers, 2000-2025

You also want an ePaper? Increase the reach of your titles
YUMPU automatically turns print PDFs into web optimized ePapers that Google loves.
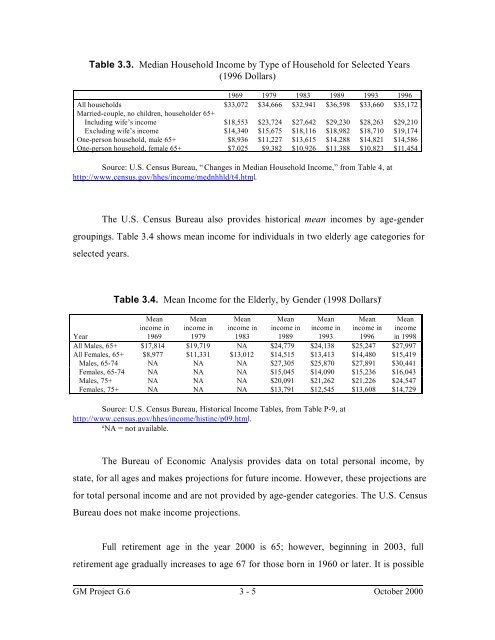
Table 3.3. Median Household Income by Type of Household for Selected Years<br />
(1996 Dollars)<br />
1969 1979 1983 1989 1993 1996<br />
All households $33,072 $34,666 $32,941 $36,598 $33,660 $35,172<br />
Married-couple, no children, householder 65+<br />
Includ<strong>in</strong>g wife’s <strong>in</strong>come<br />
$18,553 $23,724 $27,642 $29,230 $28,263 $29,210<br />
Exclud<strong>in</strong>g wife’s <strong>in</strong>come<br />
$14,340 $15,675 $18,116 $18,982 $18,710 $19,174<br />
One-person household, male 65+ $8,936 $11,227 $13,615 $14,288 $14,821 $14,586<br />
One-person household, female 65+ $7,025 $9,382 $10,926 $11,388 $10,823 $11,454<br />
Source: U.S. Census Bureau, “Changes <strong>in</strong> Median Household Income,” from Table 4, at<br />
http://www.census.gov/hhes/<strong>in</strong>come/mednhhld/t4.html .<br />
The U.S. Census Bureau also provides historical mean <strong>in</strong>comes by age-gender<br />
group<strong>in</strong>gs. Table 3.4 shows mean <strong>in</strong>come for <strong>in</strong>dividuals <strong>in</strong> two elderly age categories for<br />
selected years.<br />
Year<br />
Table 3.4. Mean Income for the Elderly, by Gender (1998 Dollars) a<br />
Mean<br />
<strong>in</strong>come <strong>in</strong><br />
1969<br />
Mean<br />
<strong>in</strong>come <strong>in</strong><br />
1979<br />
Mean<br />
<strong>in</strong>come <strong>in</strong><br />
1983<br />
Mean<br />
<strong>in</strong>come <strong>in</strong><br />
1989<br />
Mean<br />
<strong>in</strong>come <strong>in</strong><br />
1993<br />
Mean<br />
<strong>in</strong>come <strong>in</strong><br />
1996<br />
Mean<br />
<strong>in</strong>come<br />
<strong>in</strong> 1998<br />
All Males, 65+ $17,814 $19,719 NA $24,779 $24,138 $25,247 $27,997<br />
All Females, 65+ $8,977 $11,331 $13,012 $14,515 $13,413 $14,480 $15,419<br />
Males, 65-74 NA NA NA $27,305 $25,870 $27,891 $30,441<br />
Females, 65-74 NA NA NA $15,045 $14,090 $15,236 $16,043<br />
Males, 75+ NA NA NA $20,091 $21,262 $21,226 $24,547<br />
Females, 75+ NA NA NA $13,791 $12,545 $13,608 $14,729<br />
Source: U.S. Census Bureau, Historical Income Tables, from Table P-9, at<br />
http://www.census.gov/hhes/<strong>in</strong>come/hist<strong>in</strong>c/p09.html .<br />
a NA = not available.<br />
The Bureau of Economic Analysis provides data on total personal <strong>in</strong>come, by<br />
state, for all ages and makes projections for future <strong>in</strong>come. However, these projections are<br />
for total personal <strong>in</strong>come and are not provided by age-gender categories. The U.S. Census<br />
Bureau does not make <strong>in</strong>come projections.<br />
Full retirement age <strong>in</strong> the year <strong>2000</strong> is 65; however, beg<strong>in</strong>n<strong>in</strong>g <strong>in</strong> 2003, full<br />
retirement age gradually <strong>in</strong>creases to age 67 for those born <strong>in</strong> 1960 or later. It is possible<br />
GM Project G.6 3 - 5 October <strong>2000</strong>


