

Projecting Fatalities in Crashes Involving Older Drivers, 2000-2025
Projecting Fatalities in Crashes Involving Older Drivers, 2000-2025
Projecting Fatalities in Crashes Involving Older Drivers, 2000-2025

You also want an ePaper? Increase the reach of your titles
YUMPU automatically turns print PDFs into web optimized ePapers that Google loves.
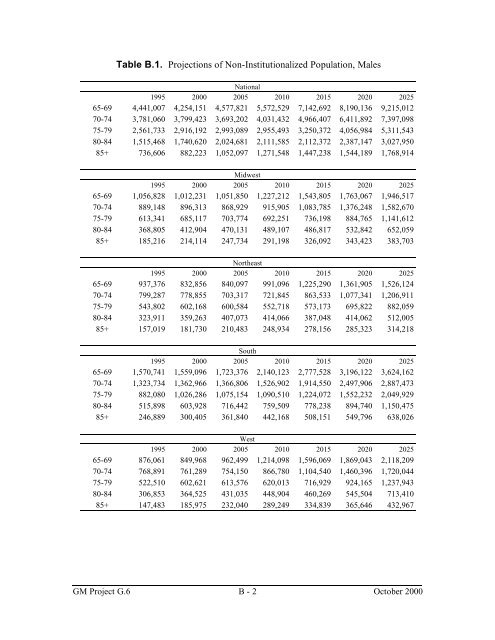
Table B.1. Projections of Non-Institutionalized Population, Males<br />
National<br />
1995 <strong>2000</strong> 2005 2010 2015 2020 <strong>2025</strong><br />
65-69 4,441,007 4,254,151 4,577,821 5,572,529 7,142,692 8,190,136 9,215,012<br />
70-74 3,781,060 3,799,423 3,693,202 4,031,432 4,966,407 6,411,892 7,397,098<br />
75-79 2,561,733 2,916,192 2,993,089 2,955,493 3,250,372 4,056,984 5,311,543<br />
80-84 1,515,468 1,740,620 2,024,681 2,111,585 2,112,372 2,387,147 3,027,950<br />
85+ 736,606 882,223 1,052,097 1,271,548 1,447,238 1,544,189 1,768,914<br />
Midwest<br />
1995 <strong>2000</strong> 2005 2010 2015 2020 <strong>2025</strong><br />
65-69 1,056,828 1,012,231 1,051,850 1,227,212 1,543,805 1,763,067 1,946,517<br />
70-74 889,148 896,313 868,929 915,905 1,083,785 1,376,248 1,582,670<br />
75-79 613,341 685,117 703,774 692,251 736,198 884,765 1,141,612<br />
80-84 368,805 412,904 470,131 489,107 486,817 532,842 652,059<br />
85+ 185,216 214,114 247,734 291,198 326,092 343,423 383,703<br />
Northeast<br />
1995 <strong>2000</strong> 2005 2010 2015 2020 <strong>2025</strong><br />
65-69 937,376 832,856 840,097 991,096 1,225,290 1,361,905 1,526,124<br />
70-74 799,287 778,855 703,317 721,845 863,533 1,077,341 1,206,911<br />
75-79 543,802 602,168 600,584 552,718 573,173 695,822 882,059<br />
80-84 323,911 359,263 407,073 414,066 387,048 414,062 512,005<br />
85+ 157,019 181,730 210,483 248,934 278,156 285,323 314,218<br />
South<br />
1995 <strong>2000</strong> 2005 2010 2015 2020 <strong>2025</strong><br />
65-69 1,570,741 1,559,096 1,723,376 2,140,123 2,777,528 3,196,122 3,624,162<br />
70-74 1,323,734 1,362,966 1,366,806 1,526,902 1,914,550 2,497,906 2,887,473<br />
75-79 882,080 1,026,286 1,075,154 1,090,510 1,224,072 1,552,232 2,049,929<br />
80-84 515,898 603,928 716,442 759,509 778,238 894,740 1,150,475<br />
85+ 246,889 300,405 361,840 442,168 508,151 549,796 638,026<br />
West<br />
1995 <strong>2000</strong> 2005 2010 2015 2020 <strong>2025</strong><br />
65-69 876,061 849,968 962,499 1,214,098 1,596,069 1,869,043 2,118,209<br />
70-74 768,891 761,289 754,150 866,780 1,104,540 1,460,396 1,720,044<br />
75-79 522,510 602,621 613,576 620,013 716,929 924,165 1,237,943<br />
80-84 306,853 364,525 431,035 448,904 460,269 545,504 713,410<br />
85+ 147,483 185,975 232,040 289,249 334,839 365,646 432,967<br />
GM Project G.6 B - 2<br />
October <strong>2000</strong>


