

Projecting Fatalities in Crashes Involving Older Drivers, 2000-2025
Projecting Fatalities in Crashes Involving Older Drivers, 2000-2025
Projecting Fatalities in Crashes Involving Older Drivers, 2000-2025

Create successful ePaper yourself
Turn your PDF publications into a flip-book with our unique Google optimized e-Paper software.
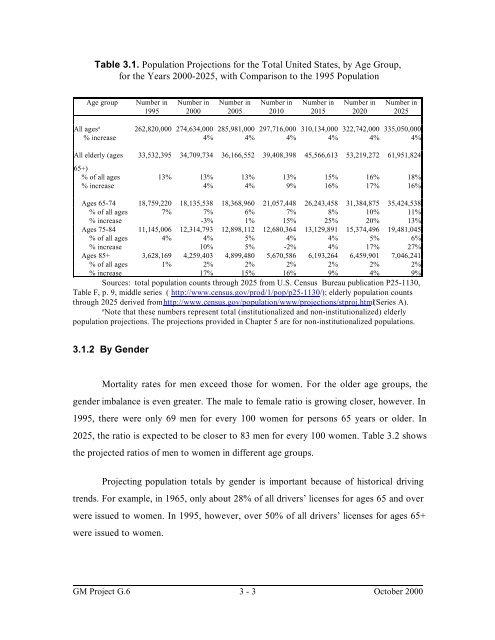
Table 3.1. Population Projections for the Total United States, by Age Group,<br />
for the Years <strong>2000</strong>-<strong>2025</strong>, with Comparison to the 1995 Population<br />
Age group Number <strong>in</strong><br />
1995<br />
Number <strong>in</strong><br />
<strong>2000</strong><br />
Number <strong>in</strong><br />
2005<br />
Number <strong>in</strong><br />
2010<br />
Number <strong>in</strong><br />
2015<br />
Number <strong>in</strong><br />
2020<br />
Number <strong>in</strong><br />
<strong>2025</strong><br />
All ages a 262,820,000 274,634,000 285,981,000 297,716,000 310,134,000 322,742,000 335,050,000<br />
% <strong>in</strong>crease 4% 4% 4% 4% 4% 4%<br />
All elderly (ages<br />
33,532,395 34,709,734 36,166,552 39,408,398 45,566,613 53,219,272 61,951,824<br />
65+)<br />
% of all ages 13% 13% 13% 13% 15% 16% 18%<br />
% <strong>in</strong>crease 4% 4% 9% 16% 17% 16%<br />
Ages 65-74 18,759,220 18,135,538 18,368,960 21,057,448 26,243,458 31,384,875 35,424,538<br />
% of all ages 7% 7% 6% 7% 8% 10% 11%<br />
% <strong>in</strong>crease -3% 1% 15% 25% 20% 13%<br />
Ages 75-84 11,145,006 12,314,793 12,898,112 12,680,364 13,129,891 15,374,496 19,481,045<br />
% of all ages 4% 4% 5% 4% 4% 5% 6%<br />
% <strong>in</strong>crease 10% 5% -2% 4% 17% 27%<br />
Ages 85+ 3,628,169 4,259,403 4,899,480 5,670,586 6,193,264 6,459,901 7,046,241<br />
% of all ages 1% 2% 2% 2% 2% 2% 2%<br />
% <strong>in</strong>crease 17% 15% 16% 9% 4% 9%<br />
Sources: total population counts through <strong>2025</strong> from U.S. Census Bureau publication P25-1130,<br />
Table F, p. 9, middle series ( http://www.census.gov/prod/1/pop/p25-1130/ ); elderly population counts<br />
through <strong>2025</strong> derived from http://www.census.gov/population/www/projections/stproj.html(Series<br />
A).<br />
aNote that these numbers represent total (<strong>in</strong>stitutionalized and non-<strong>in</strong>stitutionalized) elderly<br />
population projections. The projections provided <strong>in</strong> Chapter 5 are for non-<strong>in</strong>stitutionalized populations.<br />
3.1.2 By Gender<br />
Mortality rates for men exceed those for women. For the older age groups, the<br />
gender imbalance is even greater. The male to female ratio is grow<strong>in</strong>g closer, however. In<br />
1995, there were only 69 men for every 100 women for persons 65 years or older. In<br />
<strong>2025</strong>, the ratio is expected to be closer to 83 men for every 100 women. Table 3.2 shows<br />
the projected ratios of men to women <strong>in</strong> different age groups.<br />
<strong>Project<strong>in</strong>g</strong> population totals by gender is important because of historical driv<strong>in</strong>g<br />
trends. For example, <strong>in</strong> 1965, only about 28% of all drivers’ licenses for ages 65 and over<br />
were issued to women. In 1995, however, over 50% of all drivers’ licenses for ages 65+<br />
were issued to women.<br />
GM Project G.6 3 - 3 October <strong>2000</strong>


