

SPIRE Design Description - Research Services
SPIRE Design Description - Research Services
SPIRE Design Description - Research Services

Create successful ePaper yourself
Turn your PDF publications into a flip-book with our unique Google optimized e-Paper software.
Draft <strong>SPIRE</strong> <strong>Design</strong> <strong>Description</strong> Document<br />
optimised for the 300-400 µm range. There is a degradation in point source coupling efficiency at<br />
wavelengths beyond around 400 µm due to the decreasing aperture size relative to the wavelength. The<br />
waveguide coupling the horn to the bolometer must also have a diameter large enough to transmit at 670-<br />
µm, and so is overmoded at the shorter wavelengths within the band. This results in an increase in<br />
background radiation on the detectors and a broadening of the beam by about 20% compared to the<br />
diffraction limit at the lower end of the band (Caldwell et al. 2000).<br />
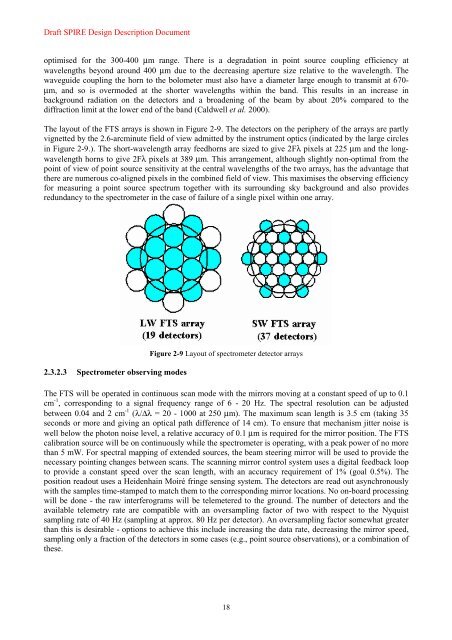
The layout of the FTS arrays is shown in Figure 2-9. The detectors on the periphery of the arrays are partly<br />
vignetted by the 2.6-arcminute field of view admitted by the instrument optics (indicated by the large circles<br />
in Figure 2-9.). The short-wavelength array feedhorns are sized to give 2Fλ pixels at 225 µm and the longwavelength<br />
horns to give 2Fλ pixels at 389 µm. This arrangement, although slightly non-optimal from the<br />
point of view of point source sensitivity at the central wavelengths of the two arrays, has the advantage that<br />
there are numerous co-aligned pixels in the combined field of view. This maximises the observing efficiency<br />
for measuring a point source spectrum together with its surrounding sky background and also provides<br />
redundancy to the spectrometer in the case of failure of a single pixel within one array.<br />
2.3.2.3 Spectrometer observing modes<br />
Figure 2-9 Layout of spectrometer detector arrays<br />
The FTS will be operated in continuous scan mode with the mirrors moving at a constant speed of up to 0.1<br />
cm -1 , corresponding to a signal frequency range of 6 - 20 Hz. The spectral resolution can be adjusted<br />
between 0.04 and 2 cm -1 (λ/∆λ = 20 - 1000 at 250 µm). The maximum scan length is 3.5 cm (taking 35<br />
seconds or more and giving an optical path difference of 14 cm). To ensure that mechanism jitter noise is<br />
well below the photon noise level, a relative accuracy of 0.1 µm is required for the mirror position. The FTS<br />
calibration source will be on continuously while the spectrometer is operating, with a peak power of no more<br />
than 5 mW. For spectral mapping of extended sources, the beam steering mirror will be used to provide the<br />
necessary pointing changes between scans. The scanning mirror control system uses a digital feedback loop<br />
to provide a constant speed over the scan length, with an accuracy requirement of 1% (goal 0.5%). The<br />
position readout uses a Heidenhain Moiré fringe sensing system. The detectors are read out asynchronously<br />
with the samples time-stamped to match them to the corresponding mirror locations. No on-board processing<br />
will be done - the raw interferograms will be telemetered to the ground. The number of detectors and the<br />
available telemetry rate are compatible with an oversampling factor of two with respect to the Nyquist<br />
sampling rate of 40 Hz (sampling at approx. 80 Hz per detector). An oversampling factor somewhat greater<br />
than this is desirable - options to achieve this include increasing the data rate, decreasing the mirror speed,<br />
sampling only a fraction of the detectors in some cases (e.g., point source observations), or a combination of<br />
these.<br />
18


