

Toll Facility Safety Study Report to Congress - About
Toll Facility Safety Study Report to Congress - About
Toll Facility Safety Study Report to Congress - About

You also want an ePaper? Increase the reach of your titles
YUMPU automatically turns print PDFs into web optimized ePapers that Google loves.
<strong>Toll</strong> <strong>Facility</strong> <strong>Safety</strong> <strong>Study</strong> <strong>Report</strong> <strong>to</strong> <strong>Congress</strong><br />
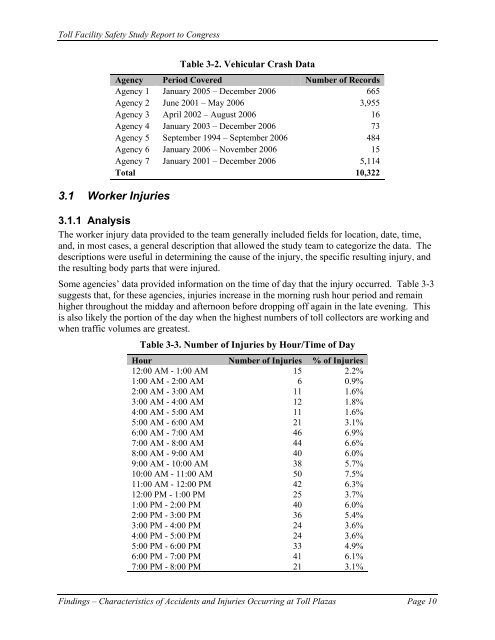
Table 3-2. Vehicular Crash Data<br />
Agency Period Covered Number of Records<br />
Agency 1 January 2005 – December 2006 665<br />
Agency 2 June 2001 – May 2006 3,955<br />
Agency 3 April 2002 – August 2006 16<br />
Agency 4 January 2003 – December 2006 73<br />
Agency 5 September 1994 – September 2006 484<br />
Agency 6 January 2006 – November 2006 15<br />
Agency 7 January 2001 – December 2006 5,114<br />
Total 10,322<br />
3.1 Worker Injuries<br />
3.1.1 Analysis<br />
The worker injury data provided <strong>to</strong> the team generally included fields for location, date, time,<br />
and, in most cases, a general description that allowed the study team <strong>to</strong> categorize the data. The<br />
descriptions were useful in determining the cause of the injury, the specific resulting injury, and<br />
the resulting body parts that were injured.<br />
Some agencies’ data provided information on the time of day that the injury occurred. Table 3-3<br />
suggests that, for these agencies, injuries increase in the morning rush hour period and remain<br />
higher throughout the midday and afternoon before dropping off again in the late evening. This<br />
is also likely the portion of the day when the highest numbers of <strong>to</strong>ll collec<strong>to</strong>rs are working and<br />
when traffic volumes are greatest.<br />
Table 3-3. Number of Injuries by Hour/Time of Day<br />
Hour Number of Injuries % of Injuries<br />
12:00 AM - 1:00 AM 15 2.2%<br />
1:00 AM - 2:00 AM 6 0.9%<br />
2:00 AM - 3:00 AM 11 1.6%<br />
3:00 AM - 4:00 AM 12 1.8%<br />
4:00 AM - 5:00 AM 11 1.6%<br />
5:00 AM - 6:00 AM 21 3.1%<br />
6:00 AM - 7:00 AM 46 6.9%<br />
7:00 AM - 8:00 AM 44 6.6%<br />
8:00 AM - 9:00 AM 40 6.0%<br />
9:00 AM - 10:00 AM 38 5.7%<br />
10:00 AM - 11:00 AM 50 7.5%<br />
11:00 AM - 12:00 PM 42 6.3%<br />
12:00 PM - 1:00 PM 25 3.7%<br />
1:00 PM - 2:00 PM 40 6.0%<br />
2:00 PM - 3:00 PM 36 5.4%<br />
3:00 PM - 4:00 PM 24 3.6%<br />
4:00 PM - 5:00 PM 24 3.6%<br />
5:00 PM - 6:00 PM 33 4.9%<br />
6:00 PM - 7:00 PM 41 6.1%<br />
7:00 PM - 8:00 PM 21 3.1%<br />
Findings – Characteristics of Accidents and Injuries Occurring at <strong>Toll</strong> Plazas Page 10


