

Toll Facility Safety Study Report to Congress - About
Toll Facility Safety Study Report to Congress - About
Toll Facility Safety Study Report to Congress - About

You also want an ePaper? Increase the reach of your titles
YUMPU automatically turns print PDFs into web optimized ePapers that Google loves.
<strong>Toll</strong> <strong>Facility</strong> <strong>Safety</strong> <strong>Study</strong> <strong>Report</strong> <strong>to</strong> <strong>Congress</strong><br />
Cause of the accident.<br />
Accident type (e.g., sideswipe, rear-end, etc.).<br />
Violation committed.<br />
Number of injuries.<br />
Number of fatalities.<br />
Police crash report number.<br />
General comments.<br />
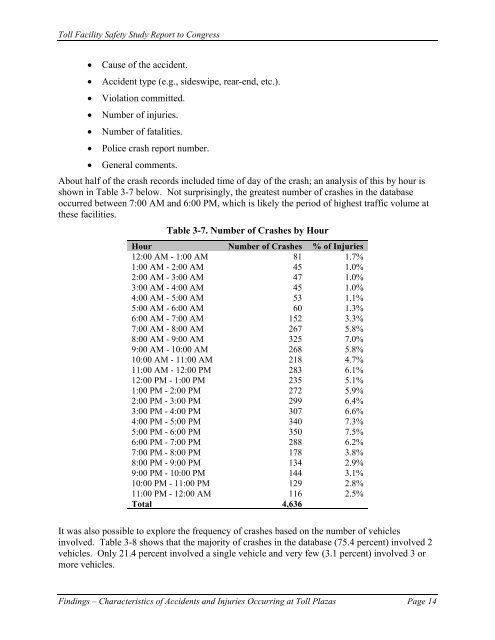
<strong>About</strong> half of the crash records included time of day of the crash; an analysis of this by hour is<br />
shown in Table 3-7 below. Not surprisingly, the greatest number of crashes in the database<br />
occurred between 7:00 AM and 6:00 PM, which is likely the period of highest traffic volume at<br />
these facilities.<br />
Table 3-7. Number of Crashes by Hour<br />
Hour Number of Crashes % of Injuries<br />
12:00 AM - 1:00 AM 81 1.7%<br />
1:00 AM - 2:00 AM 45 1.0%<br />
2:00 AM - 3:00 AM 47 1.0%<br />
3:00 AM - 4:00 AM 45 1.0%<br />
4:00 AM - 5:00 AM 53 1.1%<br />
5:00 AM - 6:00 AM 60 1.3%<br />
6:00 AM - 7:00 AM 152 3.3%<br />
7:00 AM - 8:00 AM 267 5.8%<br />
8:00 AM - 9:00 AM 325 7.0%<br />
9:00 AM - 10:00 AM 268 5.8%<br />
10:00 AM - 11:00 AM 218 4.7%<br />
11:00 AM - 12:00 PM 283 6.1%<br />
12:00 PM - 1:00 PM 235 5.1%<br />
1:00 PM - 2:00 PM 272 5.9%<br />
2:00 PM - 3:00 PM 299 6.4%<br />
3:00 PM - 4:00 PM 307 6.6%<br />
4:00 PM - 5:00 PM 340 7.3%<br />
5:00 PM - 6:00 PM 350 7.5%<br />
6:00 PM - 7:00 PM 288 6.2%<br />
7:00 PM - 8:00 PM 178 3.8%<br />
8:00 PM - 9:00 PM 134 2.9%<br />
9:00 PM - 10:00 PM 144 3.1%<br />
10:00 PM - 11:00 PM 129 2.8%<br />
11:00 PM - 12:00 AM 116 2.5%<br />
Total 4,636<br />
It was also possible <strong>to</strong> explore the frequency of crashes based on the number of vehicles<br />
involved. Table 3-8 shows that the majority of crashes in the database (75.4 percent) involved 2<br />
vehicles. Only 21.4 percent involved a single vehicle and very few (3.1 percent) involved 3 or<br />
more vehicles.<br />
Findings – Characteristics of Accidents and Injuries Occurring at <strong>Toll</strong> Plazas Page 14


