

Toll Facility Safety Study Report to Congress - About
Toll Facility Safety Study Report to Congress - About
Toll Facility Safety Study Report to Congress - About

You also want an ePaper? Increase the reach of your titles
YUMPU automatically turns print PDFs into web optimized ePapers that Google loves.
<strong>Toll</strong> <strong>Facility</strong> <strong>Safety</strong> <strong>Study</strong> <strong>Report</strong> <strong>to</strong> <strong>Congress</strong><br />
Injury Number of Injuries % of Injuries<br />
Pain 211 11.0%<br />
Sprain 205 10.7%<br />
Bruising 188 9.8%<br />
Twist 79 4.1%<br />
Burning/Irritated/Itching 76 4.0%<br />
Swelling 35 1.8%<br />
Insect Bite/Sting 33 1.7%<br />
Soreness 31 1.6%<br />
Fracture 30 1.6%<br />
Headache 21 1.1%<br />
Puncture 17 0.9%<br />
Pulled Muscle 16 0.8%<br />
Trouble breathing 14 0.7%<br />
Burn 10 0.5%<br />
Multiple 8 0.4%<br />
Stress 8 0.4%<br />
Other 167 8.7%<br />
Total 1,911<br />
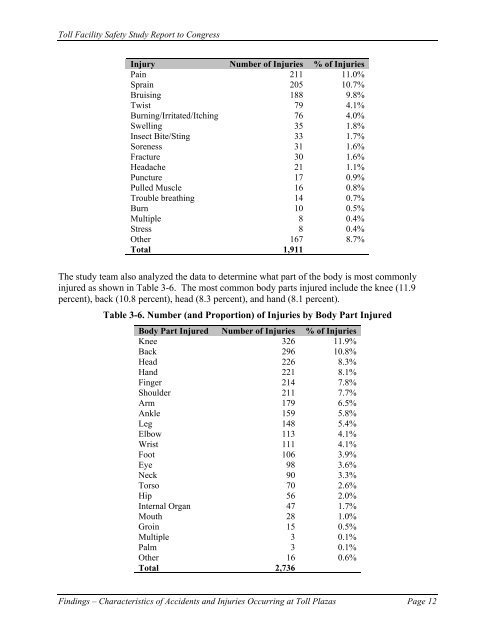
The study team also analyzed the data <strong>to</strong> determine what part of the body is most commonly<br />
injured as shown in Table 3-6. The most common body parts injured include the knee (11.9<br />
percent), back (10.8 percent), head (8.3 percent), and hand (8.1 percent).<br />
Table 3-6. Number (and Proportion) of Injuries by Body Part Injured<br />
Body Part Injured Number of Injuries % of Injuries<br />
Knee 326 11.9%<br />
Back 296 10.8%<br />
Head 226 8.3%<br />
Hand 221 8.1%<br />
Finger 214 7.8%<br />
Shoulder 211 7.7%<br />
Arm 179 6.5%<br />
Ankle 159 5.8%<br />
Leg 148 5.4%<br />
Elbow 113 4.1%<br />
Wrist 111 4.1%<br />
Foot 106 3.9%<br />
Eye 98 3.6%<br />
Neck 90 3.3%<br />
Torso 70 2.6%<br />
Hip 56 2.0%<br />
Internal Organ 47 1.7%<br />
Mouth 28 1.0%<br />
Groin 15 0.5%<br />
Multiple 3 0.1%<br />
Palm 3 0.1%<br />
Other 16 0.6%<br />
Total 2,736<br />
Findings – Characteristics of Accidents and Injuries Occurring at <strong>Toll</strong> Plazas Page 12


