- 229- TRYBOM, F., und WOLLEBACK, A., 1904: Obersicht über die Seefisdierei Schwedens an den südlidien und iistlichen Küsten dieses Landes. Publ , Circ., 13 A. [Survey of the sea fishery of Sweden on the southern and eastern coasts of thiS country] — 1910: Bericht über die Aufzucht, Markicrung und den .Fang von Lachsen und Meerforellen [ 1). 371] im Ostseegebiet wâhrend der Jahre 1904-1908. Rap. Proc. Verb., Vol. 12/6. [Report on the rearing, tagging and the capture of salmon and sea trout in the region of the Baltic Sea in the years 1904 to 1908] TWOMEY, E., and RIORDAN, A. 0., 1963: Novements of Salmon around Ireland, IX. Proc. Royal Ir. Akad., Vol. 93 B 5. VLADHLOV, V. D., 1956: Fecundity of Wild Speckled Trout (Salvelinus fontinalis) in Quebec lakes. J. Fish. Res. Bd. Canada, 13/5. WENT, A. E. J.; 1956: The Irish drift net fishery for Salmon. J. Dptrnt. Agr., Vol. 52. — 1964: Irish Salmon, a review of investigations up to 1963. Scient. Proc. Royal Dubl. Soc., Ser. A, Vol. 1/15. WHITE, H. C., 1936: The food of Kingfishers and Mergansers on the Margeree river, Nova Scotia. J. Fish. Res. Bd. Canada, 2/3. — 1937: The food of Salmon fry in eastern Canada. J. Fish. Res. Bd. Canada, 2/5. — 1939: Factors influencing descent of Atlantic Salmon smolts, Nova Scotia. J. Fish. Res. Bd. Canada, 415. WISBY, W. J., and HASLER, A. D., 1954: Effect of olfactory occlusion in migrating Silver Salmon. J. Fish. Res. Bd. Canada, 11/4. Wn.LER, A., und QUEDNAU, W., 1931: Untersuchungen über den Ladis (Salmo salar L.). Z. f. Fisch., 29. [Investigations of the salmon (Salmo salar L.)]
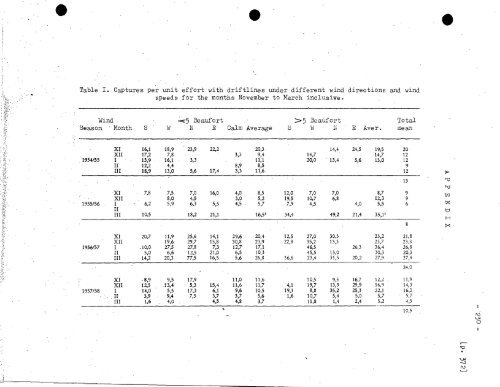
Table I. Captures per unit effort with driftlines under different wind directions and wind Speeds for the months November to March inclusive. Wind • •Season Month 5 Beaufort >5 Beaufort To tal E Calm Average S W E Aver. mean • XI 16,1 18,9 . 23,9 22,2 20,3 14,4 24,5 19,5 20 XII 17,2 7,8 3,3 9,4 14,7 14,7 12 1954/55 I 13,9 16,1 3,3 11,1 20,0 13,4 5,6 13,0 12 II 12,2 4,4 8,9 8,5 9 III 18,9 13,0 5,6 17,4 3,3 11,6 12 XI 7,8 7,5 7,0 16,0 4,0 8,5 12,0 7,0 7,0 8,7 9 XII 8,0 4,5 3,0 5,2 19,5 10,7 6,8 12,3 9 1955/56 I - 6,2 5,9 6,3 5,5 4,5 S 5,7 7,9 4,5 4,0 5,5 6 II III 10,5 18,2 21,1 16,5 1 34,4 49,2 21,4 35,1 1 XI 20,7 11,9 25,6 14,1 29,6 20,4 12,5 27,0 30,3 23,2 21,8 XII 19,6 29,7 15,8 30,8 23,9 22,8 35,2 13,3 23,7 23,8 1956/57 I .10,0 27,5 27,8 7,3 12,7 17,1 46,5 26,3 36,4 26,8 II 5,0 6,6 12,5 21,0 6,5 10,3 45,5 15,0 30,3 20,3 III 14,2 20,3 77,5 16,5 5,6 26,8 36,6 23,4 31,5 20,2 27,9 27,4 XI . 8,9 9,5 17,9 11,0 11,6 10,5 9,5 16,7 12,2 11,9 XII 12,5 13,4 5,3 15,4 11,6 11,7 4,1 19,7 13,9 29,9 16,9 14,3 1957/58 I 14,0 5,5 17,3 6,1 9,6 10,5 19,3 8,8 35,2 25,3 22,1 16,3 - II 3,9 9,4 7,5 3,7 3,7 5,6 1,6 10,7 5,4 5,0 5,7 5,7 III 1,6 4,0 4,5 4,8 3,7 11,8 1,4 2,4 5,2 4,5 13 8 24,0 10,5 tx.1 1-1 • f\.) o
- Page 1 and 2:
FISHERIES RESEARCH BOARD OF CANADA
- Page 3 and 4:
sos-2cto—lo-31 DEPARTMENTOFTHESEC
- Page 5 and 6:
• 6.1. Previous investigations 17
- Page 7 and 8:
-5-. and Kerr very much later menti
- Page 9 and 10:
treated as a quality, a special pop
- Page 11 and 12:
• -9-- per cent). Furthermore, th
- Page 13 and 14:
• - 11 - fishery, mentions the gr
- Page 15 and 16:
• - 13 - in LiepUva. These voyage
- Page 17 and 18:
• 1948/49 545 1949/50 730 1950/51
- Page 19 and 20:
• 2.2.1. River fishing - 16- The
- Page 21 and 22:
- 18- are 50 norsels, 60 to 80 cm l
- Page 23 and 24:
• nets give better results is onl
- Page 25 and 26:
• • G Fig. 4. End buoy for salm
- Page 27 and 28:
• with • Total length (cm) Mout
- Page 29 and 30:
• • - 25- of Bothnia. In the fa
- Page 31 and 32:
• • - 27- increase the catch. S
- Page 33 and 34:
• of • fishing representsavalue
- Page 35 and 36:
• to lower figures than in the fa
- Page 37 and 38:
• • Umfang = Cire umference - 3
- Page 39 and 40:
• - 35 - and nape corresponds to
- Page 41 and 42:
• • / 100 50 Selektion Selectio
- Page 43 and 44:
- 39 - In Table 9 have been calcula
- Page 45 and 46:
. Table 10. Number of salmon per 10
- Page 47 and 48:
• Table 11. Number of salmon per.
- Page 49 and 50:
• - 45 - cza-ci, es When consider
- Page 51 and 52:
- 47 - If We examine once more the
- Page 53 and 54:
- 49 - German fishermen work during
- Page 55 and 56:
• - 51 - is true, have to be corr
- Page 57 and 58:
Table 16. Seasonal yields of the fi
- Page 59 and 60:
Table 17. Monthly average weights o
- Page 61 and 62:
- 57 - In February and March hardly
- Page 63 and 64:
• Table 20. Additional catch of c
- Page 65 and 66:
• 100 50 60 100 cm Totallarle . 2
- Page 67 and 68:
• subject to an error of ± o.op9
- Page 69 and 70:
cycle) during the second . period o
- Page 71 and 72:
• their third year. , Recruitment
- Page 73 and 74:
50 r-■ 2 / bet; 56cm = 1 fis 1 li
- Page 75 and 76:
• - 71 - ovary that has already b
- Page 77 and 78:
5 - 73 - April 1960 the diameter of
- Page 79 and 80:
- 75 - oocytes can be demonstrated
- Page 81 and 82:
. ineftlerer Mean OocytendurcArness
- Page 83 and 84:
- 79 - furnish the energy fer the s
- Page 85 and 86:
' 1741 salmon, which were.caught be
- Page 87 and 88:
• - 83- the series of measurement
- Page 89 and 90:
- 85 - the relative amount of eggs
- Page 91 and 92:
- 87 - The calculation of a formula
- Page 93 and 94:
- 89 - area of distribution is form
- Page 95 and 96:
- 91 - as percentages of thé recov
- Page 97 and 98:
Table 22. The recapture of tagged s
- Page 99 and 100:
• II> Three conclusions can be dr
- Page 101 and 102:
• 6 65- 64 - 62-. 61 - 6 . 5 . 59
- Page 103 and 104:
• - 99 - fish. The tagging does n
- Page 105 and 106:
- 101 - tagging experiments'that sa
- Page 107 and 108:
- 103- Renne Bank in about 60 m dep
- Page 109 and 110:
• 9:1 0 a) el-4 o (XI -P CNI 4- o
- Page 111 and 112:
14,3 14,3 30,7 31,3 27,7 6,0 15,0 1
- Page 113 and 114:
Table 26. Catches of salmon in the
- Page 115 and 116:
- 111 - between Hela and Kahlberg r
- Page 117 and 118:
• - 113- 5 .. Age and growth of t
- Page 119 and 120:
cm 100 80 60 40 - 1 15- customarily
- Page 121 and 122:
found can be used for the recalcula
- Page 123 and 124:
v 0 00 0 I I - 119- of the scales.
- Page 125 and 126:
- 121 - The interpretation of the y
- Page 127 and 128:
• - 1 23 - the age groups 2.B to
- Page 129 and 130:
• L s - L c r s 0.85 Smolt Ls = l
- Page 131 and 132:
5.3. The'age composition of the Ger
- Page 133 and 134:
-129- with shares in the catch of o
- Page 135 and 136:
"ervoct. Yeer-Le- -e-t. '4.y-c.1*.e
- Page 137 and 138:
1955 1 2 3 4 23 3 61 506 7 3 135 21
- Page 139 and 140:
- 135 - yeAy-ctt4 thé explanation
- Page 141 and 142:
• • _ Table 33. The composition
- Page 143 and 144:
Table 34. Composition by age of cat
- Page 145 and 146:
- 141 - yeAy-cle..es Table 35. The
- Page 147 and 148:
- 143 - • U7,) tdL comparablenece
- Page 149 and 150:
• whereas the present data .(1957
- Page 151 and 152:
Sin% 0,1 2,8 37,0 96,8 100,0 - 147-
- Page 153 and 154:
• - 149 - these results 38 per ce
- Page 155 and 156:
• • Number of salmon J. en1967
- Page 157 and 158:
4. number 50 e" • ); e e , lot nb
- Page 159 and 160:
they take account of the annual cha
- Page 161 and 162:
• -157- and in the stock are bein
- Page 163 and 164:
Table 43. Mean lengths of age group
- Page 165 and 166:
• - 161 - of these catches has be
- Page 167 and 168:
- 163 - of enolt in Fig. 36. From a
- Page 169 and 170:
--165 - increase'in weight is more
- Page 171 and 172:
• rl -P b..0 -e nzi -ri r-1 gl a)
- Page 173 and 174:
- 169 - CLA‘s set of smolt of 193
- Page 175 and 176:
Year's sets of smolt CILS present 7
- Page 177 and 178:
- 173 - necessary to follow the gro
- Page 179 and 180:
- 175 - • been ascertained from t
- Page 181 and 182:
(after K. A. Pyefinch 1955). — 17
- Page 183 and 184: • gadids and sticklebacks (after
- Page 185 and 186: - 181 - especially decisive in, the
- Page 187 and 188: 6.3.1. Seasonal fluctuations 36,9 2
- Page 189 and 190: • Number of Months Gear salmon in
- Page 191 and 192: MagerdW hing 40 , 20 Filling of Sto
- Page 193 and 194: Deep could be examined. - 188 - Chr
- Page 195 and 196: - 190 - salmon . switch over to the
- Page 197 and 198: • - 192 - recognizable after seve
- Page 199 and 200: - 194 - amount of food. Under-consi
- Page 201 and 202: - 196- expenditure, composition in
- Page 203 and 204: • - 1 98- the stock losses are co
- Page 205 and 206: NUmber of salmon per Z Weigh- Seaso
- Page 207 and 208: • 'Table 55. Values of the total
- Page 209 and 210: - 204 experiment were about 40 per
- Page 211 and 212: - 206- strength of the stock N pert
- Page 213 and 214: • N„ Z o = cf„ (M1- T) -- In
- Page 215 and 216: — 210— the coefficient for the
- Page 217 and 218: - 212- In a further paper Piggins (
- Page 219 and 220: - 214- shifted and the fOod supply
- Page 221 and 222: - 216 - concerns the yield of captu
- Page 223 and 224: nachafter 00 04 0,3 0,4 2 1 0,5 6 9
- Page 225 and 226: • 1. (5 100 000) (4 250 000) 4 25
- Page 227 and 228: • •em.ilts - 222 - in an error
- Page 229 and 230: • - 224- BRANDT, A. y. , 1959: Fa
- Page 231 and 232: - 226 - Paw, T. H., 1938: Fluctuati
- Page 233: - 228- PETERSEN, C. G. .11, and Orr
- Page 237 and 238: Table II. Captures per unit effort
- Page 239 and 240: • Yea.r Sweden Continuation Table
- Page 241 and 242: Table VI. Ratio between fork le . B