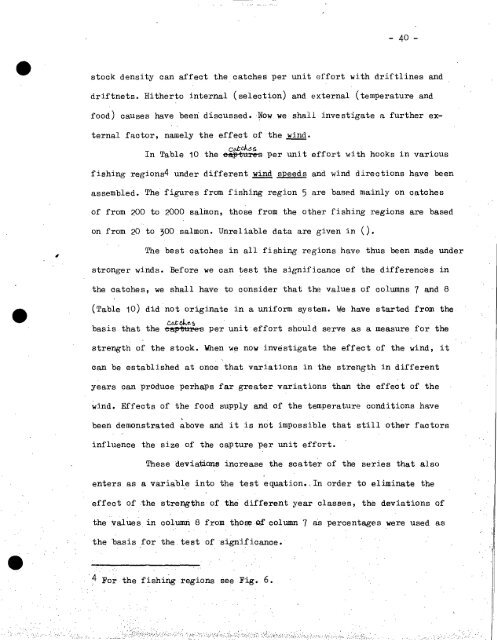
-4o- stock density can affect the catches per unit effort with driftlines and driftnets. Hitherto internal (selection) and external (temperature and food) causes have been discussed. Now we shall investigate a further ex- ternal factor, namely the effect of the wind. cecÂd.!.. In Table 10 the eep-teres per unit effort with hooks in various fishing regions4 under different wind slpeeds and wind directions have been assembled. The figures from fishing region 5 are based mainly on catches of from 200 to 2000 salkon, those from the other fishing regions are based on from 20 to 300 salmon. Unreliable data are given in Q. The best catches in all fishing regions have thus been made under stronger winds. Before we can test the significance of the differences in the catches, we shall have to consider that the values of columns 7 and 8 (Table 10) did not originate in a uniform system. We have started from the ceckes basis that the ceetutaee per unit effort should serve as a measure for the strength of the stock. When we now investigate the effect of the wind, it can be established at once that variations in the strength in different years can produce perhaps far greater variations than the effect of the wind. Effects of the food supply and of the temperature conditions have been demonstrated above and it is not impossible that still other factors influence the size of the capture per unit effort. • These deviations increase the scatter of the series that also enters as a variable into the test equation.,In order to eliminate the effect of the strengths.of the different year classes, the deviations of the Values in column 8 from thogeof column 7 as percentages were used as the Iasis for the test of significance.' 4 For the fishing regions see Fig. 6. -
. Table 10. Number of salmon per 1000 hooks in dependence on the fishing grounds and wind directions (weighted means). (For fishing grounds see Fig. 6.) 1 ' • 2 3 4 5 6 7 8 9 - Fishing Time of Weighted Total« ‹z 5 Beaufort >5 Beaufort ground Season capture Calm mean weighted S W N E S W N E var. 5 B . mean Simple mean Simple mean Signifik eu wert Value of significance f 000 fur 54 for differences. - amone catches.. Der cent . le 81 1,15 68 Simple mean 0.1111% .. _ - .. 1956/57.. X • 5,0 11,1 0,0 14,6 17,6 27,4 ' 9,9 21,8 13,2 1957/58 . -X-I 11,1 21,4 . - • 14,3 15,4 . 7,8 11,5 14,6 12,5 1958/59 ' X-I 14,2 4,7 55,7 33,0 85,7 4,4 « 22,4 19,3 20,9 1959/60 • X-II . . 11,7 7,0 . 4,1 16,6 18,3 35,8 14,2 7,3 19,2 11,9 1960/61 X-XI ' 6,5 . 8,9 10,1 9,7 5,8 • 15,9 8,9 • 14,6 11,4 1961/62 X-XI 7,6 10,9 10,6 11,5 10,9 12,5 6,4 14,2 9,0 - 10,7 9,7 1962/63 VII I-X 7,9 '. - 4,1 . 14,4 5,2 8,6 7,6 12,3 5,3 - . 6,1 • 8,9 - 8,1 8,8 8,2 18,5 9,2 15,8 26,0 8,9 19,7 11,0 10,7 15,6 12,5 , SignifiLmvwert t Value of significance f 3,02 für Fangdifferenzeni °/o for differences among catches per cent 97,5 1954/55 XI-III 15,5 12,9 14,2 19,3 15,8 13,9 15,0 3,3 14,4 15,2 14,6 1955/56 XI-V 7,2 7,0 7,6 17,7 19,7 11,2 13,4 20,1 4,9 8,9 15,7 11,2 1956/57 X-V 16,0 19,7 26,3 15,5 29,2 32,9 21,3 23,6 18,1 20,3 29,1 23,0 1957/58 X-I V 11,4 10,2 13,0 8,1 17,9 15,4 6,9 24,6 8,8 10,2 14,3 11,6 1958/59 X-IV 11,4 14,3 12,3 13,2 23,1 37,8 33,2 18,8 12,3 13,2 33,7 18,5 1959/60 X-I I I 9,0 8,7 8,0 8,5 10,8 7,6 8,7 10,1 7,2 8,7 9,9 8,9 1960/61 XI-III 12,0 19,0 10,2 8,5 11,4 11,7 19,8 10,0 8,0 11,5 13,2 12,0 1961/62 XI-IV 14,5 17,4 15,3 11,4 15,2 30,1 16,3 13,7 4,3 15,4 20,3 1 7,3 X-V 9,1 8,5 9,1 7,1 9,9 9,0 7,0 16,1 8,6 9,1 8,8 1962/63 X-IV 11,8 13,1 12,9 12,2 17,2 19,1 16,7 15,9 9,2 12,4 17,9 14,0 1956/57 X 10,2 11,0 - 12,9 8,5 21,7 26,8 21,3 4,9 10,4 24,9 11,8 I 1957/58 X-I 9,2 8,6 5,6 4,1 9,5 8,1 7,3 10,3 8,4 8,5 8,4 1958/59 XI-11 6,3 7,0 11,0 22,3 18,6 13,7 12,0 18,6 12,5 6 1959/60 X-I V 5,4 7,9 4,7 7,9 3,9 15,6 9,8 3,6 6,0 9,9 6,8 t 1960.'61 X-I 4,7 10,0 - 11,4 7,1 13,8 12,8 9,0 13,8 9,3 1961/62 XI-III 6,9 5,6 9,2 7,4 6,7 13,0 16,7 7,2 15,5 10,6 1962/63 XI-IV 6,6 11,4 4,5 . 11,3 10,4 10,6 8,3 16,2 8,5 9,8 12,1 10,5 • 7,1 8,8 .8,5 1 0, 8 12,1 12,7 13,4 12,5 9,0 9,0 14,8 10,0 _ 3,53 ignifiltriztvert für Fang di fferenzenl t c1 / Value te significance t for differences among catches per cent 99,1 NI 1 Zwisdlen deri Einheitsanen < tmd > 5 Bnuftirt..« Be twe e n the catches pér unit effort -. -2 - .and >5 Beaufort 2,63 97,1 r-n . -P. Ce
- Page 1 and 2: FISHERIES RESEARCH BOARD OF CANADA
- Page 3 and 4: sos-2cto—lo-31 DEPARTMENTOFTHESEC
- Page 5 and 6: • 6.1. Previous investigations 17
- Page 7 and 8: -5-. and Kerr very much later menti
- Page 9 and 10: treated as a quality, a special pop
- Page 11 and 12: • -9-- per cent). Furthermore, th
- Page 13 and 14: • - 11 - fishery, mentions the gr
- Page 15 and 16: • - 13 - in LiepUva. These voyage
- Page 17 and 18: • 1948/49 545 1949/50 730 1950/51
- Page 19 and 20: • 2.2.1. River fishing - 16- The
- Page 21 and 22: - 18- are 50 norsels, 60 to 80 cm l
- Page 23 and 24: • nets give better results is onl
- Page 25 and 26: • • G Fig. 4. End buoy for salm
- Page 27 and 28: • with • Total length (cm) Mout
- Page 29 and 30: • • - 25- of Bothnia. In the fa
- Page 31 and 32: • • - 27- increase the catch. S
- Page 33 and 34: • of • fishing representsavalue
- Page 35 and 36: • to lower figures than in the fa
- Page 37 and 38: • • Umfang = Cire umference - 3
- Page 39 and 40: • - 35 - and nape corresponds to
- Page 41 and 42: • • / 100 50 Selektion Selectio
- Page 43: - 39 - In Table 9 have been calcula
- Page 47 and 48: • Table 11. Number of salmon per.
- Page 49 and 50: • - 45 - cza-ci, es When consider
- Page 51 and 52: - 47 - If We examine once more the
- Page 53 and 54: - 49 - German fishermen work during
- Page 55 and 56: • - 51 - is true, have to be corr
- Page 57 and 58: Table 16. Seasonal yields of the fi
- Page 59 and 60: Table 17. Monthly average weights o
- Page 61 and 62: - 57 - In February and March hardly
- Page 63 and 64: • Table 20. Additional catch of c
- Page 65 and 66: • 100 50 60 100 cm Totallarle . 2
- Page 67 and 68: • subject to an error of ± o.op9
- Page 69 and 70: cycle) during the second . period o
- Page 71 and 72: • their third year. , Recruitment
- Page 73 and 74: 50 r-■ 2 / bet; 56cm = 1 fis 1 li
- Page 75 and 76: • - 71 - ovary that has already b
- Page 77 and 78: 5 - 73 - April 1960 the diameter of
- Page 79 and 80: - 75 - oocytes can be demonstrated
- Page 81 and 82: . ineftlerer Mean OocytendurcArness
- Page 83 and 84: - 79 - furnish the energy fer the s
- Page 85 and 86: ' 1741 salmon, which were.caught be
- Page 87 and 88: • - 83- the series of measurement
- Page 89 and 90: - 85 - the relative amount of eggs
- Page 91 and 92: - 87 - The calculation of a formula
- Page 93 and 94: - 89 - area of distribution is form
- Page 95 and 96:
- 91 - as percentages of thé recov
- Page 97 and 98:
Table 22. The recapture of tagged s
- Page 99 and 100:
• II> Three conclusions can be dr
- Page 101 and 102:
• 6 65- 64 - 62-. 61 - 6 . 5 . 59
- Page 103 and 104:
• - 99 - fish. The tagging does n
- Page 105 and 106:
- 101 - tagging experiments'that sa
- Page 107 and 108:
- 103- Renne Bank in about 60 m dep
- Page 109 and 110:
• 9:1 0 a) el-4 o (XI -P CNI 4- o
- Page 111 and 112:
14,3 14,3 30,7 31,3 27,7 6,0 15,0 1
- Page 113 and 114:
Table 26. Catches of salmon in the
- Page 115 and 116:
- 111 - between Hela and Kahlberg r
- Page 117 and 118:
• - 113- 5 .. Age and growth of t
- Page 119 and 120:
cm 100 80 60 40 - 1 15- customarily
- Page 121 and 122:
found can be used for the recalcula
- Page 123 and 124:
v 0 00 0 I I - 119- of the scales.
- Page 125 and 126:
- 121 - The interpretation of the y
- Page 127 and 128:
• - 1 23 - the age groups 2.B to
- Page 129 and 130:
• L s - L c r s 0.85 Smolt Ls = l
- Page 131 and 132:
5.3. The'age composition of the Ger
- Page 133 and 134:
-129- with shares in the catch of o
- Page 135 and 136:
"ervoct. Yeer-Le- -e-t. '4.y-c.1*.e
- Page 137 and 138:
1955 1 2 3 4 23 3 61 506 7 3 135 21
- Page 139 and 140:
- 135 - yeAy-ctt4 thé explanation
- Page 141 and 142:
• • _ Table 33. The composition
- Page 143 and 144:
Table 34. Composition by age of cat
- Page 145 and 146:
- 141 - yeAy-cle..es Table 35. The
- Page 147 and 148:
- 143 - • U7,) tdL comparablenece
- Page 149 and 150:
• whereas the present data .(1957
- Page 151 and 152:
Sin% 0,1 2,8 37,0 96,8 100,0 - 147-
- Page 153 and 154:
• - 149 - these results 38 per ce
- Page 155 and 156:
• • Number of salmon J. en1967
- Page 157 and 158:
4. number 50 e" • ); e e , lot nb
- Page 159 and 160:
they take account of the annual cha
- Page 161 and 162:
• -157- and in the stock are bein
- Page 163 and 164:
Table 43. Mean lengths of age group
- Page 165 and 166:
• - 161 - of these catches has be
- Page 167 and 168:
- 163 - of enolt in Fig. 36. From a
- Page 169 and 170:
--165 - increase'in weight is more
- Page 171 and 172:
• rl -P b..0 -e nzi -ri r-1 gl a)
- Page 173 and 174:
- 169 - CLA‘s set of smolt of 193
- Page 175 and 176:
Year's sets of smolt CILS present 7
- Page 177 and 178:
- 173 - necessary to follow the gro
- Page 179 and 180:
- 175 - • been ascertained from t
- Page 181 and 182:
(after K. A. Pyefinch 1955). — 17
- Page 183 and 184:
• gadids and sticklebacks (after
- Page 185 and 186:
- 181 - especially decisive in, the
- Page 187 and 188:
6.3.1. Seasonal fluctuations 36,9 2
- Page 189 and 190:
• Number of Months Gear salmon in
- Page 191 and 192:
MagerdW hing 40 , 20 Filling of Sto
- Page 193 and 194:
Deep could be examined. - 188 - Chr
- Page 195 and 196:
- 190 - salmon . switch over to the
- Page 197 and 198:
• - 192 - recognizable after seve
- Page 199 and 200:
- 194 - amount of food. Under-consi
- Page 201 and 202:
- 196- expenditure, composition in
- Page 203 and 204:
• - 1 98- the stock losses are co
- Page 205 and 206:
NUmber of salmon per Z Weigh- Seaso
- Page 207 and 208:
• 'Table 55. Values of the total
- Page 209 and 210:
- 204 experiment were about 40 per
- Page 211 and 212:
- 206- strength of the stock N pert
- Page 213 and 214:
• N„ Z o = cf„ (M1- T) -- In
- Page 215 and 216:
— 210— the coefficient for the
- Page 217 and 218:
- 212- In a further paper Piggins (
- Page 219 and 220:
- 214- shifted and the fOod supply
- Page 221 and 222:
- 216 - concerns the yield of captu
- Page 223 and 224:
nachafter 00 04 0,3 0,4 2 1 0,5 6 9
- Page 225 and 226:
• 1. (5 100 000) (4 250 000) 4 25
- Page 227 and 228:
• •em.ilts - 222 - in an error
- Page 229 and 230:
• - 224- BRANDT, A. y. , 1959: Fa
- Page 231 and 232:
- 226 - Paw, T. H., 1938: Fluctuati
- Page 233 and 234:
- 228- PETERSEN, C. G. .11, and Orr
- Page 235 and 236:
Table I. Captures per unit effort w
- Page 237 and 238:
Table II. Captures per unit effort
- Page 239 and 240:
• Yea.r Sweden Continuation Table
- Page 241 and 242:
Table VI. Ratio between fork le . B