wradlib Documentation - Bitbucket
wradlib Documentation - Bitbucket
wradlib Documentation - Bitbucket

You also want an ePaper? Increase the reach of your titles
YUMPU automatically turns print PDFs into web optimized ePapers that Google loves.
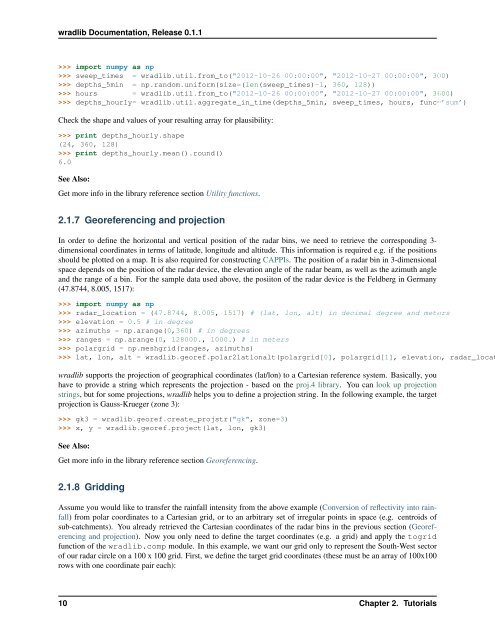
<strong>wradlib</strong> <strong>Documentation</strong>, Release 0.1.1<br />
>>> import numpy as np<br />
>>> sweep_times = <strong>wradlib</strong>.util.from_to("2012-10-26 00:00:00", "2012-10-27 00:00:00", 300)<br />
>>> depths_5min = np.random.uniform(size=(len(sweep_times)-1, 360, 128))<br />
>>> hours = <strong>wradlib</strong>.util.from_to("2012-10-26 00:00:00", "2012-10-27 00:00:00", 3600)<br />
>>> depths_hourly= <strong>wradlib</strong>.util.aggregate_in_time(depths_5min, sweep_times, hours, func=’sum’)<br />
Check the shape and values of your resulting array for plausibility:<br />
>>> print depths_hourly.shape<br />
(24, 360, 128)<br />
>>> print depths_hourly.mean().round()<br />
6.0<br />
See Also:<br />
Get more info in the library reference section Utility functions.<br />
2.1.7 Georeferencing and projection<br />
In order to define the horizontal and vertical position of the radar bins, we need to retrieve the corresponding 3-<br />
dimensional coordinates in terms of latitude, longitude and altitude. This information is required e.g. if the positions<br />
should be plotted on a map. It is also required for constructing CAPPIs. The position of a radar bin in 3-dimensional<br />
space depends on the position of the radar device, the elevation angle of the radar beam, as well as the azimuth angle<br />
and the range of a bin. For the sample data used above, the posiiton of the radar device is the Feldberg in Germany<br />
(47.8744, 8.005, 1517):<br />
>>> import numpy as np<br />
>>> radar_location = (47.8744, 8.005, 1517) # (lat, lon, alt) in decimal degree and meters<br />
>>> elevation = 0.5 # in degree<br />
>>> azimuths = np.arange(0,360) # in degrees<br />
>>> ranges = np.arange(0, 128000., 1000.) # in meters<br />
>>> polargrid = np.meshgrid(ranges, azimuths)<br />
>>> lat, lon, alt = <strong>wradlib</strong>.georef.polar2latlonalt(polargrid[0], polargrid[1], elevation, radar_locat<br />
<strong>wradlib</strong> supports the projection of geographical coordinates (lat/lon) to a Cartesian reference system. Basically, you<br />
have to provide a string which represents the projection - based on the proj.4 library. You can look up projection<br />
strings, but for some projections, <strong>wradlib</strong> helps you to define a projection string. In the following example, the target<br />
projection is Gauss-Krueger (zone 3):<br />
>>> gk3 = <strong>wradlib</strong>.georef.create_projstr("gk", zone=3)<br />
>>> x, y = <strong>wradlib</strong>.georef.project(lat, lon, gk3)<br />
See Also:<br />
Get more info in the library reference section Georeferencing.<br />
2.1.8 Gridding<br />
Assume you would like to transfer the rainfall intensity from the above example (Conversion of reflectivity into rainfall)<br />
from polar coordinates to a Cartesian grid, or to an arbitrary set of irregular points in space (e.g. centroids of<br />
sub-catchments). You already retrieved the Cartesian coordinates of the radar bins in the previous section (Georeferencing<br />
and projection). Now you only need to define the target coordinates (e.g. a grid) and apply the togrid<br />
function of the <strong>wradlib</strong>.comp module. In this example, we want our grid only to represent the South-West sector<br />
of our radar circle on a 100 x 100 grid. First, we define the target grid coordinates (these must be an array of 100x100<br />
rows with one coordinate pair each):<br />
10 Chapter 2. Tutorials