wradlib Documentation - Bitbucket
wradlib Documentation - Bitbucket
wradlib Documentation - Bitbucket

You also want an ePaper? Increase the reach of your titles
YUMPU automatically turns print PDFs into web optimized ePapers that Google loves.
<strong>wradlib</strong> <strong>Documentation</strong>, Release 0.1.1<br />
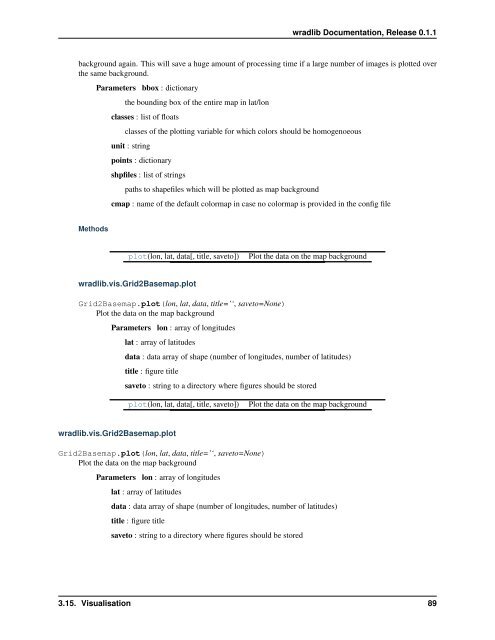
background again. This will save a huge amount of processing time if a large number of images is plotted over<br />
the same background.<br />
Parameters bbox : dictionary<br />
the bounding box of the entire map in lat/lon<br />
classes : list of floats<br />
classes of the plotting variable for which colors should be homogenoeous<br />
unit : string<br />
points : dictionary<br />
shpfiles : list of strings<br />
paths to shapefiles which will be plotted as map background<br />
cmap : name of the default colormap in case no colormap is provided in the config file<br />
Methods<br />
plot(lon, lat, data[, title, saveto])<br />
Plot the data on the map background<br />
<strong>wradlib</strong>.vis.Grid2Basemap.plot<br />
Grid2Basemap.plot(lon, lat, data, title=’‘, saveto=None)<br />
Plot the data on the map background<br />
Parameters lon : array of longitudes<br />
lat : array of latitudes<br />
data : data array of shape (number of longitudes, number of latitudes)<br />
title : figure title<br />
saveto : string to a directory where figures should be stored<br />
3.15. Visualisation 89