wradlib Documentation - Bitbucket
wradlib Documentation - Bitbucket
wradlib Documentation - Bitbucket

You also want an ePaper? Increase the reach of your titles
YUMPU automatically turns print PDFs into web optimized ePapers that Google loves.
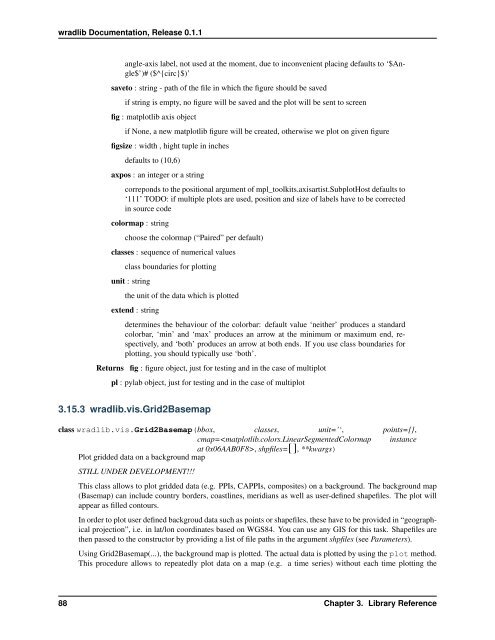
<strong>wradlib</strong> <strong>Documentation</strong>, Release 0.1.1<br />
angle-axis label, not used at the moment, due to inconvenient placing defaults to ‘$Angle$’)#<br />
($^{circ}$)’<br />
saveto : string - path of the file in which the figure should be saved<br />
if string is empty, no figure will be saved and the plot will be sent to screen<br />
fig : matplotlib axis object<br />
if None, a new matplotlib figure will be created, otherwise we plot on given figure<br />
figsize : width , hight tuple in inches<br />
defaults to (10,6)<br />
axpos : an integer or a string<br />
correponds to the positional argument of mpl_toolkits.axisartist.SubplotHost defaults to<br />
‘111’ TODO: if multiple plots are used, position and size of labels have to be corrected<br />
in source code<br />
colormap : string<br />
choose the colormap (“Paired” per default)<br />
classes : sequence of numerical values<br />
class boundaries for plotting<br />
unit : string<br />
the unit of the data which is plotted<br />
extend : string<br />
determines the behaviour of the colorbar: default value ‘neither’ produces a standard<br />
colorbar, ‘min’ and ‘max’ produces an arrow at the minimum or maximum end, respectively,<br />
and ‘both’ produces an arrow at both ends. If you use class boundaries for<br />
plotting, you should typically use ‘both’.<br />
Returns fig : figure object, just for testing and in the case of multiplot<br />
pl : pylab object, just for testing and in the case of multiplot<br />
3.15.3 <strong>wradlib</strong>.vis.Grid2Basemap<br />
class <strong>wradlib</strong>.vis.Grid2Basemap(bbox, classes, unit=’‘, points={},<br />
cmap=, shpfiles=[], **kwargs)<br />
Plot gridded data on a background map<br />
STILL UNDER DEVELOPMENT!!!<br />
This class allows to plot gridded data (e.g. PPIs, CAPPIs, composites) on a background. The background map<br />
(Basemap) can include country borders, coastlines, meridians as well as user-defined shapefiles. The plot will<br />
appear as filled contours.<br />
In order to plot user defined backgroud data such as points or shapefiles, these have to be provided in “geographical<br />
projection”, i.e. in lat/lon coordinates based on WGS84. You can use any GIS for this task. Shapefiles are<br />
then passed to the constructor by providing a list of file paths in the argument shpfiles (see Parameters).<br />
Using Grid2Basemap(...), the background map is plotted. The actual data is plotted by using the plot method.<br />
This procedure allows to repeatedly plot data on a map (e.g. a time series) without each time plotting the<br />
88 Chapter 3. Library Reference